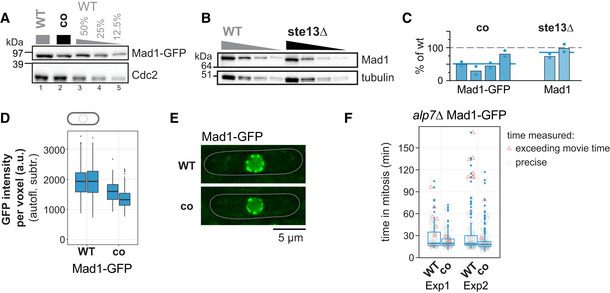
Figure 6. Codon identity in mad1 + is important for proper protein concentration.

-
AImmunoblot of S. pombe protein extracts from cells expressing wild‐type (WT) or codon‐optimized (co) Mad1‐GFP probed with antibodies against GFP and Cdc2 (loading control). Lanes 3–5 are a dilution series of the extract from wild‐type cells.
-
BImmunoblot of protein extracts from wild‐type (WT) or ste13Δ strains probed with antibodies against Mad1 and tubulin (loading control). A 1:1 dilution series was loaded for quantification. Tubulin blot is the same as in Fig 4B.
-
CEstimates of the protein concentration relative to wild‐type conditions from experiments such as in (A) and (B). Bars are experimental replicates, dots are technical replicates. Blue lines indicate the mean of all experiments. Two‐sided t‐tests: P = 0.005 (Mad1‐co, n = 4 experimental replicates); P = 0.16 (Mad1 ste13Δ, n = 2).
-
DWhole‐cell GFP concentration from individual live‐cell fluorescence microscopy experiments (a.u. = arbitrary units). Boxplots show median and interquartile range (IQR); whiskers extend to values no further than 1.5 times the IQR from the first and third quartile, respectively. Codon‐optimized concentration significantly lower than wild type (generalized linear mixed model). Mad1‐GFP: n = 197 and 224; Mad1‐co‐GFP: n = 80 and 377 cells.
-
ERepresentative images from one of the experiments in (D). An average projection of three Z‐slices is shown; cells are outlined in gray.
-
FLive‐cell imaging for time spent in mitosis. The alp7 + gene was deleted to increase the likelihood of spindle assembly checkpoint activation. Localization of Plo1‐tdTomato to spindle‐pole bodies was used to judge entry into and exit from mitosis (also see Appendix Fig S4). Exp1: n = 73 (WT) and 94 cells (co); Exp2: n = 126 (WT) and 152 cells (co). Boxplots show median and interquartile range (IQR); whiskers extend to values no further than 1.5 times the IQR from the first and third quartile, respectively. Measurements for individual cells are shown in addition (gray circles if measurement was exact, red triangles if end of mitosis was not captured because imaging ended). Difference between WT and co: P = 0.14 (Exp1) and 0.15 (Exp2) by Kolmogorov–Smirnov test.
Source data are available online for this figure.
