Figure 2.
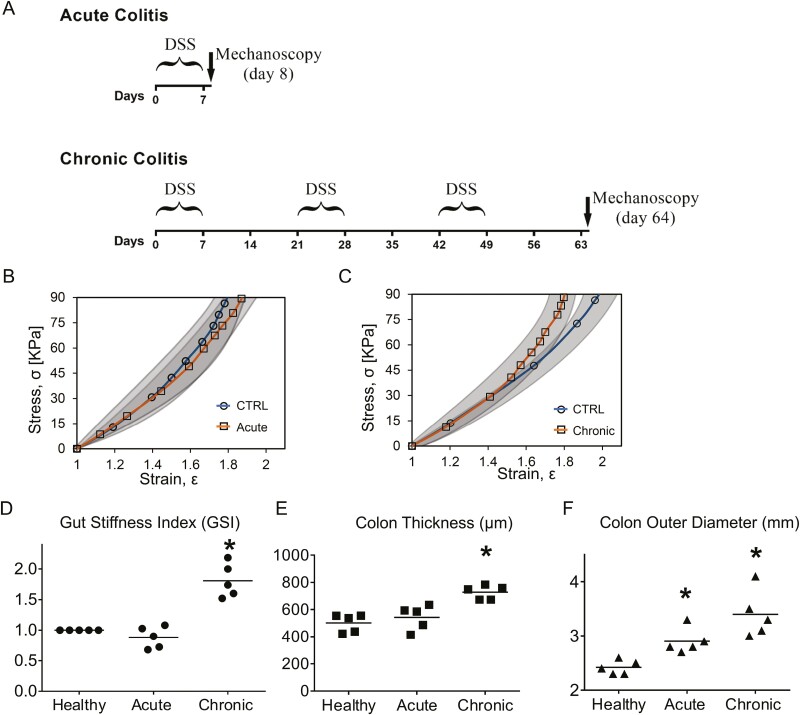
Gut diameter and gut stiffness index (GSI) for potential inflammation diagnosis. A, Illustration for the acute colitis model and the chronic colitis model. B, The stress-strain responses acquired from the deflation phase of colon show no significant difference between healthy group and acute colitis group. Gray areas show standard deviation. C, Beyond the critical strain at a level of 1.5, chronic colitis group shows significant colon stiffening compared with the healthy group. D, GSI is defined as the local slope of stress-strain curve at ε = 1.6 and normalized with respect to the healthy group. Gut stiffness index shows slight decreases for the acute group, but not significant decreases. However, GSI significantly increases about 1.8 times for chronic group. E, Compared with the healthy group, the chronic colitis colon significantly thickened 42%. F, Compared with the healthy group, the gut initial outer diameters increase significantly for both the acute and chronic groups. The chronic colitis group shows a greater increase (n = 5, ∗V.S. healthy group, P < .05, Student t test).

