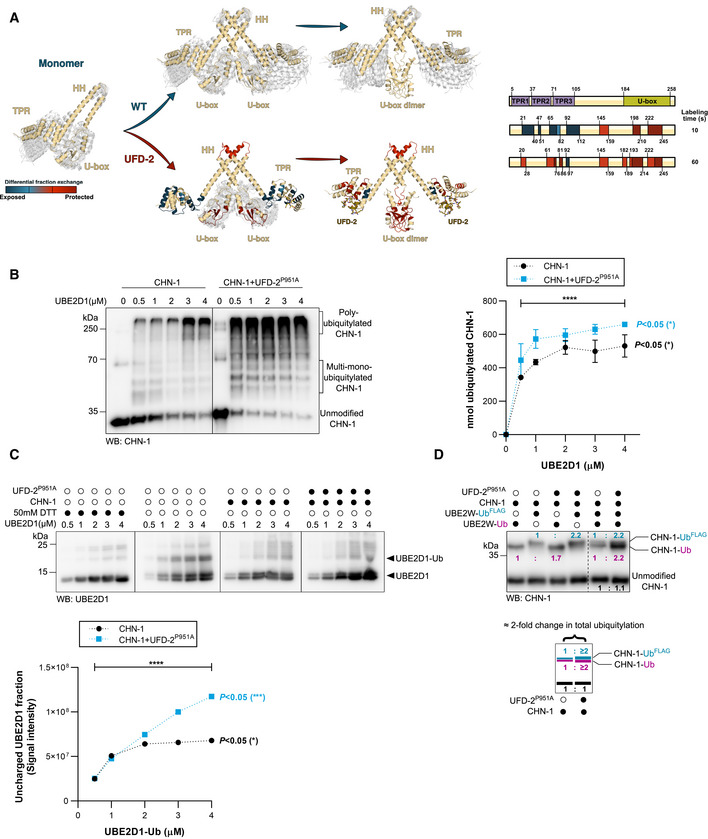
Figure 2. UFD‐2 stabilizes CHN‐1 U‐box dimer.

-
AHDX‐MS was used to analyze changes in the structural dynamics of residues within CHN‐1 when complexed with UFD‐2. The model diagram represents regions of retarded (red) and enhanced (blue) exchange in CHN‐1. Right, schematics showing CHN‐1 domain organization and the rate of deuterium exchange (colored box: blue, light red, medium red, and dark red) in the different domains upon interaction with UFD‐2.
-
BCHN‐1 auto‐Ub was performed as indicated using increasing molar concentrations (0.5, 1, 2, 3, 4 μM) of UBE2D1 E2 without and with a complexing equimolar concentration (1:1) of recombinant CHN‐1 and UFD‐2P951A (1.5 μM CHN‐1 with 1.5 μM of recombinant UFD‐2P951A). Protein samples were resolved via SDS–PAGE and immunoblotted with anti‐CHN‐1 antibodies. Right, a graph representing the nmol of ubiquitylated CHN‐1 vs. UBE2D1 (μM) for CHN‐1 alone (black) or CHN‐1 + UFD‐2P951A (cyan). Plotted data are the mean from the three technical replicates. Error bars represent the SEM; statistical significance was determined using Pearson's correlation coefficients which define the statistical relation between two continuous variables [nmol of ubiquitylated CHN‐1 vs. UBE2D1(μM) in the presence of CHN‐1 or CHN‐1 + UFD‐2P951A and CHN‐1 vs. CHN‐1 + UFD‐2P951A with increasing UBE2D1(μM)] (*P < 0.05; ****P < 0.0001).
-
CDischarging assay of Ub‐charged UBE2D1 was carried out in the presence of CHN‐1 or CHN‐1‐UFD‐2P951A. The experimental sample was run together with the control with and without a reducing agent (50 mM DTT). The reaction was stopped after 30 min via the addition of Laemmli sample buffer. Proteins were resolved via SDS–PAGE and immunoblotted with anti‐UBE2D1 antibodies. Below, quantification of uncharged UBE2D1 plotted as the uncharged UBE2D1 fraction vs. UBE2D1‐Ub (μM). Plotted data are the mean of three technical replicates. Statistical significance was determined using Pearson's correlation coefficients which define the statistical relation between two continuous variables [UBE2D1 vs. UBE2D1‐Ub(μM) in the presence of CHN‐1 or CHN‐1 + UFD‐2P951A and CHN‐1 vs. CHN‐1 + UFD‐2P951A with increasing UBE2D1‐Ub(μM)] (P < 0.05; ***P < 0.001; ****P < 0.0001).
-
DCHN‐1 auto‐Ub was performed as indicated in the presence of Ube2W‐Ub or Ube2W‐UbFLAG without and with equimolar concentration of recombinant CHN‐1 and UFD‐2P951A. Protein samples were resolved via SDS–PAGE and immunoblotted with anti‐CHN‐1 antibodies. For each sample, the quantified relative signal after probing the blot using anti‐CHN‐1 antibodies is shown as a ratio above the respective signal. Below, a schematic of the CHN‐1‐UbFLAG (cyan), CHN‐1‐Ub (magenta), and unmodified CHN‐1 signal (black) presented as the ratio and the signal fold change between CHN‐1 and CHN‐1‐UFD‐2P951A.
Data information: Representative immunoblots for at least three independent experiments are shown in the panels. Source data for HDX‐MS measurements are available in the Table EV1.
