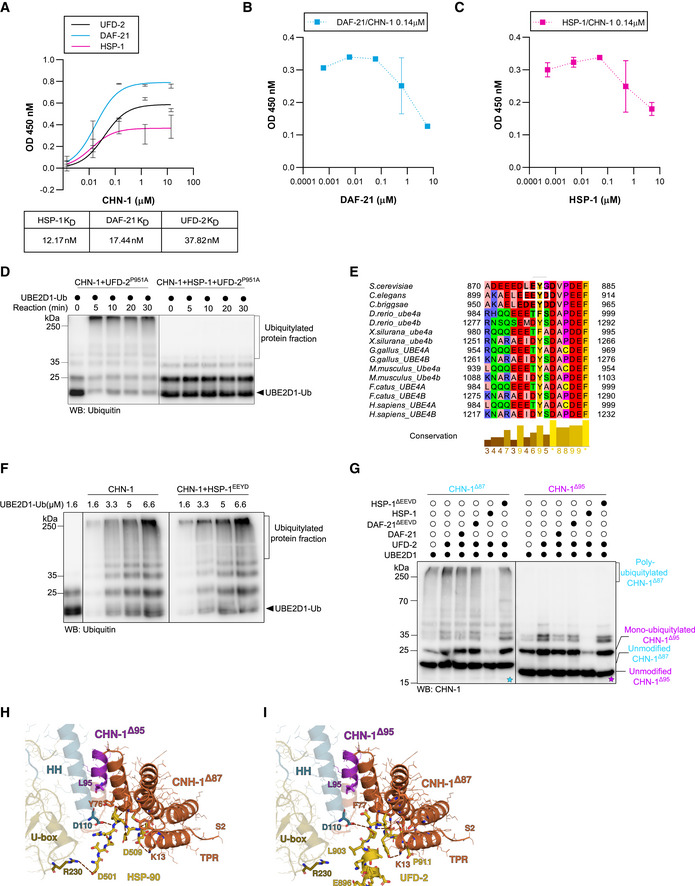
Figure EV3. CHN‐1 activity switch is induced by the interaction of its TPR domain with the HSP‐1 EEVD or UFD‐2 EEYD motif.

-
AELISA‐based titration assay to determine the dissociation constants (KD) between DAF‐21, HSP‐1, UFD‐2, and CHN‐1. Y‐axis: CHN‐1 concentration (μM). X‐axis: absorbance (OD) value at 450 nm as a function of the converted substrate (Alkaline Phosphatase Yellow). Below, a table showing the KD value (nM) of the corresponding protein with recombinant CHN‐1. Plotted data are the mean of three technical replicates. Error bars represent the SEM.
-
BELISA‐based titration assay performed using recombinant CHN‐1, UFD‐2, and DAF‐21 with the results plotted as the DAF‐21 concentration (μM) vs. absorbance (OD) value at 450 nm as a function of the converted substrate (Alkaline Phosphatase Yellow). Plotted data are the mean of three technical replicates. Error bars represent the SEM.
-
CELISA‐based titration assay performed using recombinant CHN‐1, UFD‐2, and HSP‐1 with the results plotted as the HSP‐1 concentration (μM) vs. absorbance (OD) value at 450 nm as a function of the converted substrate (Alkaline Phosphatase Yellow). Plotted data are the mean of three technical replicates. Error bars represent the SEM.
-
DIn vitro ubiquitylation assay was performed as indicated using Ub‐charged UBE2D1 in the presence of CHN‐1, UFD‐2P951A or ternary mixture of recombinant CHN‐1, UFD‐2P951A and HSP‐1. The reaction was stopped after the indicated time via the addition of Laemmli sample buffer. Protein samples were resolved via SDS–PAGE and immunoblotted with anti‐Ubiquitin antibodies.
-
EMultiple sequence alignment (MSA) of UFD‐2 from different species. Orthologous sequences from selected species were obtained from the eggNOG5 database (from Orthologous Group ID ENOG5038DSP) (Huerta‐Cepas et al, 2019) and aligned using the T‐Coffee web server with default parameters (Notredame et al, 2000; Di Tommaso et al, 2011). Vertebrates possess two UFD‐2 orthologs, which have been independently annotated. The MSA was visualized in the Jalview Desktop software (Waterhouse et al, 2009) with residues colored according to their physicochemical properties; conserved tyrosine (Y) residues and the EEYD motif in C. elegans are highlighted in white frames.
-
FIn vitro ubiquitylation assay was performed as indicated using an increasing concentration of Ub‐charged UBE2D1 (1.6, 3.3, 5, 6.6 μM) in the presence of CHN‐1 or CHN‐1 and HSP‐1EEYD. The reaction was stopped after 30 min via the addition of Laemmli sample buffer. Protein samples were resolved via SDS–PAGE and immunoblotted with anti‐Ubiquitin antibodies.
-
GAuto‐Ub of recombinant CHN‐1Δ87 (cyan) or CHN‐1Δ95 (magenta) truncation mutants as indicated using UBE2D1 E2 in the presence of UFD‐2, DAF‐21, DAF‐21ΔEEVD, HSP‐1 or HSP‐1ΔEEVD. Samples were analyzed via SDS–PAGE and immunoblotted with anti‐CHN‐1 antibodies. Cyan asterisk (*) on the blot represented the auto‐ub of CHN‐1Δ87 and magenta asterisk (*) on the blot represented the auto‐ub of CHN‐1Δ95.
-
HModel of the CHN‐1 TPR domain docked with the UFD‐2 EEYD peptide. Residues 1–86 are colored in orange and residues 87–95 of CHN‐1, which sequester the EEYD motif away from the CHN‐1 R230 residue, are colored in magenta.
-
IA co‐crystal structure of the murine CHIP TPR domain interacting with the HSP90 EEVD peptide (PDB ID 2C2L) reveals that CHIP R273 (conserved in CHN‐1 as R230) is sufficiently close in proximity to interact with HSP90 D501.
Data information: Representative immunoblots for at least three independent experiments are shown in the panels.
