-
A
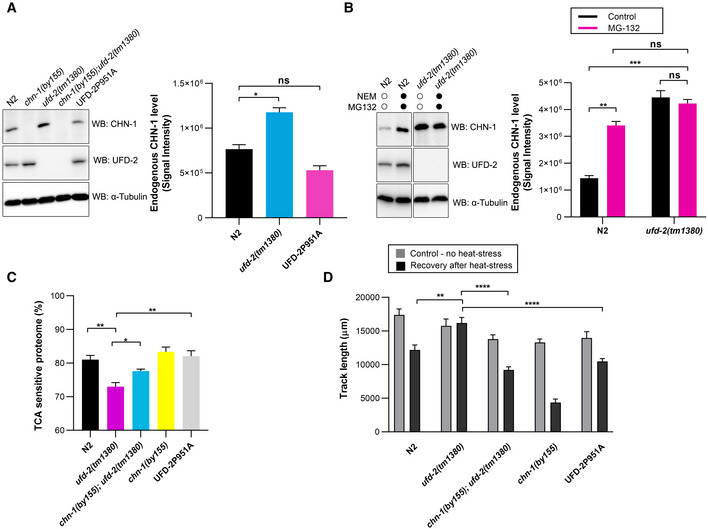
To detect CHN‐1 and UFD‐2, indicated lysates of young adult worms were subjected to immunoblotting with anti‐CHN‐1 and anti‐UFD‐2 antibodies. Tubulin served as a loading control. Right, quantification of the CHN‐1 signals normalized to tubulin levels and plotted as N2 (wild‐type; black), ufd‐2(tm1380) (cyan), and UFD‐2P951A (magenta). Plotted data are the mean of three biological replicates. Error bars represent the SEM; statistical significance was determined using an unpaired t‐test (*P < 0.05).
-
B
CHN‐1 protein levels were determined in the indicated lysates of young adult worms treated with a proteasome inhibitor (MG‐132, 10 μM) and DUB inhibitor (NEM, 100 mM). Tubulin served as a loading control. Right, quantification of the CHN‐1 signals normalized to tubulin levels plotted as control (black), or MG‐132 treated (magenta) in N2 (wild‐type) and ufd‐2(tm1380). Plotted data are the mean of three biological replicates. Error bars represent the SEM; statistical significance was determined using an unpaired t‐test (**P < 0.01; ***P < 0.001).
-
C
Graph showing the comparison of protein solubility in the presence of 10% trichloroacetic acid (TCA) presented as TCA sensitive proteome in percentage (%) in N2 (wild‐type; black), ufd‐2(tm1380) (magenta), chn‐1(by155); ufd‐2(tm1380) (cyan), chn‐1(by155) (yellow) and UFD‐2P951A (gray) worms. Y‐axis shows the percent of the entire protein sample sensitive to TCA treatment. Plotted data are the mean of three biological replicates. Error bars represent SEM; statistical significance was determined using a one‐way ANOVA test (*P < 0.05; **P < 0.01).
-
D
Measurement of the mobility of the indicated young adult worms exposed to 33°C heat stress (2 h). Graph plotted as control (gray), or recovery after heat stress (black) for N2 (wild‐type), ufd‐2(tm1380), chn‐1(by155); ufd‐2(tm1380), chn‐1(by155) and UFD‐2P951A worms. Plotted data are the mean of three biological replicates. Error bars represent SEM; statistical significance was determined using a one‐way ANOVA test (**P < 0.01; ****P < 0.0001).

