-
A
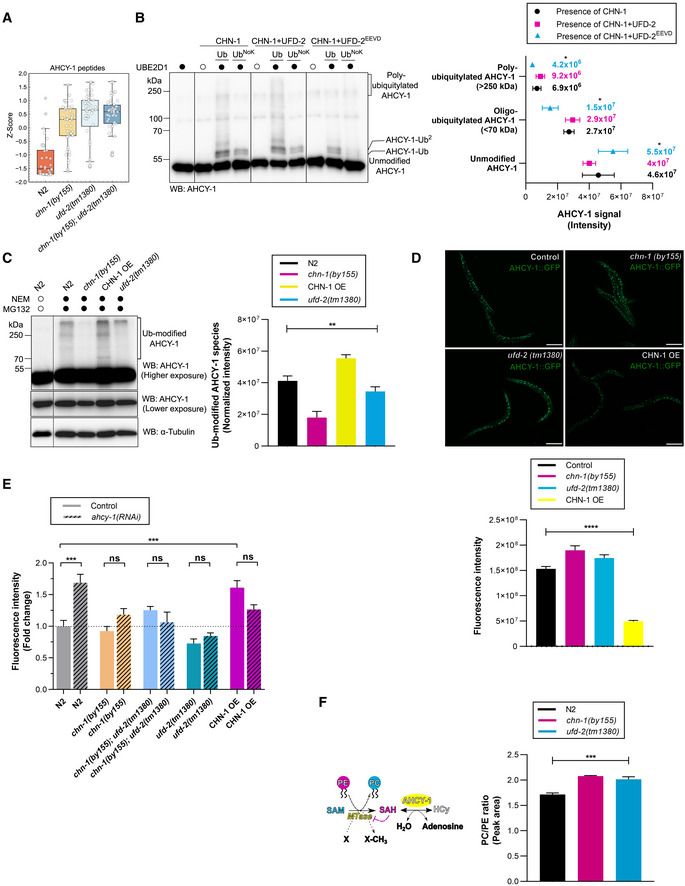
Boxplot analysis showing the Z‐score of normalized intensities of the 50 LC‐MS/MS‐identified peptides from ACHY‐1 detected in N2 (wild‐type), chn‐1(by155), ufd‐2(tm1380), and chn‐1(by155); ufd‐2(tm1380) mutant worms. The central band of each box is the median value, and the box defines the 25th (lower) and 75th (higher) quantile. The whiskers represent the minimum and maximum values in the data, excluding outliers. A data point is considered an outlier if the distance to the median is greater than 1.5 * inter quantile range distance to the median.
-
B
Ubiquitylation of recombinant AHCY‐1 was performed as indicated. Protein samples were resolved via SDS–PAGE and immunoblotted with anti‐AHCY‐1 antibodies. Right, quantification of the AHCY‐1 modifications (unmodified, oligo‐monoubiquitylated, poly‐ubiquitylated) when CHN‐1 alone (black), CHN‐1–UFD‐2 (magenta), or CHN‐1–UFD‐2EEVD (cyan). Plotted data are the mean of three technical replicates. Error bars represent SEM; statistical significance was determined using a two‐way ANOVA test (*P < 0.05).
-
C
Protein level of endogenous AHCY‐1 in N2 (wild‐type), chn‐1(by155), CHN‐1 OE, and ufd‐2(tm1380) young adult worms treated with the proteasome inhibitor (MG‐132, 10 μM) and DUB inhibitor (NEM, 100 mM). Protein samples were resolved via SDS–PAGE and immunoblotted with anti‐AHCY‐1 antibodies. Tubulin served as a loading control. Right, quantification of the modified AHCY‐1 signals plotted as Ub‐modified AHCY‐1 species normalized to unmodified endogenous AHCY‐1 signal and plotted for N2 (wild‐type; black), chn‐1(by155) (magenta), CHN‐1 OE (yellow), and ufd‐2(tm1380) (cyan). Plotted data are the mean of three biological replicates. Error bars represent SEM; statistical significance was determined using an unpaired t‐test (**P < 0.01).
-
D
Representative images of GFP::AHCY‐1 fluorescence in chn‐1(by155), ufd‐2(tm1380), and CHN‐1 OE background. Scale bar = 200 μm. Below, quantification of the AHCY‐1 GFP signal plotted as fluorescence intensity for GFP::AHCY‐1 expressing worms (control; black), chn‐1(by155) (magenta), ufd‐2(tm1380) (cyan) or CHN‐1 OE (yellow). Plotted data are the mean of three biological replicates. Error bars represent SEM; statistical significance was determined using a one‐way ANOVA test (****P < 0.0001).
-
E
Total lipid content in N2 (wild‐type), chn‐1(by155), ufd‐2(tm1380), chn‐1(by155), ufd‐2(tm1380), and CHN‐1 OE young adult worms grown on control (plain) and ahcy‐1(RNAi) (lined) feeding plates. Higher fluorescence intensity indicates increased lipid levels. Plotted data are the mean of three biological replicates. Error bars indicate SEM; statistical significance was determined using a one‐way ANOVA test (***P < 0.001).
-
F
Schematic diagram representing the core function of AHCY‐1. AHCY‐1 catalyzes the reversible hydrolysis of SAH (S‐adenosylhomocysteine) to HCy (homocysteine). SAH accumulation inhibits PC (phosphatidylcholine) synthesis from PE (phosphatidylethanolamine). Right, ratio of phosphatidylcholine (PC) to phosphatidylethanolamine (PE) in N2 (wild‐type; black), chn‐1(by155) (magenta), and ufd‐2(tm1380) (cyan) young adult worms. Plotted data are the mean of three biological replicates. Error bars indicate SEM; statistical significance was determined using a one‐way ANOVA test (***P < 0.001).

