Fig. 2.
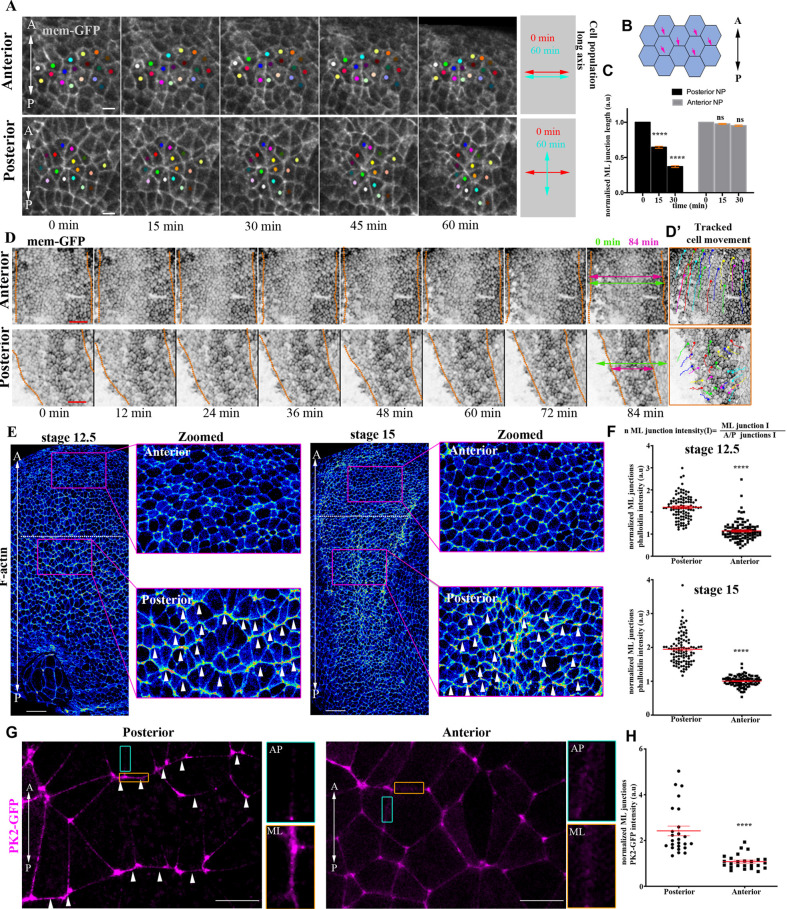
PCP-mediated cell intercalative behaviour is restricted to the posterior NP. (A) Stills from a time-lapse recording of a neurula-stage embryo. Coloured spots represent single neuroepithelial cells tracked over time. At the posterior region, cells display polarized intercalative behaviour leading to neighbour exchanges. Scale bars: 20 µm. (B) Schematic showing the neuroepithelial cell-cell junctions (pink arrows) used for the quantification of ML junction length in C. (C) Quantification of relative ML junction length at different time points. ****P<0.0001 (two-way ANOVA); mean±s.e.m.; n=4 embryos, 210 anterior and 210 posterior junctions. (D) Stills from a time-lapse recording of a neurula-stage embryo. Dotted lines indicate NP/SE boundaries. NP width (double-headed arrows) is reduced only at the posterior NP region. Scale bars: 100 µm. (D′) Tracked movement of neuroepithelial cells at the posterior and anterior NP. (E) Signal intensity colour-coded maximum intensity projections of representative neurula-stage embryos stained with Phalloidin (F-actin). Dotted line represents the A/P NP boundary. Arrowheads in zoomed images highlight the enrichment of F-actin at ML junctions. n=10 embryos for each stage. Scale bars: 100 μm. (F) Quantification of F-actin fluorescence intensity at ML junctions. ****P<0.0001 (two-sided, unpaired Student's t-test); mean±s.e.m.; n=100 junctions. (G) Representative images from a stage 14 neurula embryo exogenously expressing Prickle2-GFP (PK2-GFP). Arrowheads indicate PK2-GFP enrichment at ML junctions within the posterior NP. A/P (green box) and ML (orange box) junctions are shown at higher magnification in the images to the right. n=5 embryos. Scale bars: 20 µm. (H) Quantification of PK2-GFP localization at ML junctions. ****P<0.0001 (two-sided, unpaired Student's t-test); ns, not significant; mean±s.e.m.; n=100 junctions. A, anterior; a.u., arbitrary units; P, posterior.

