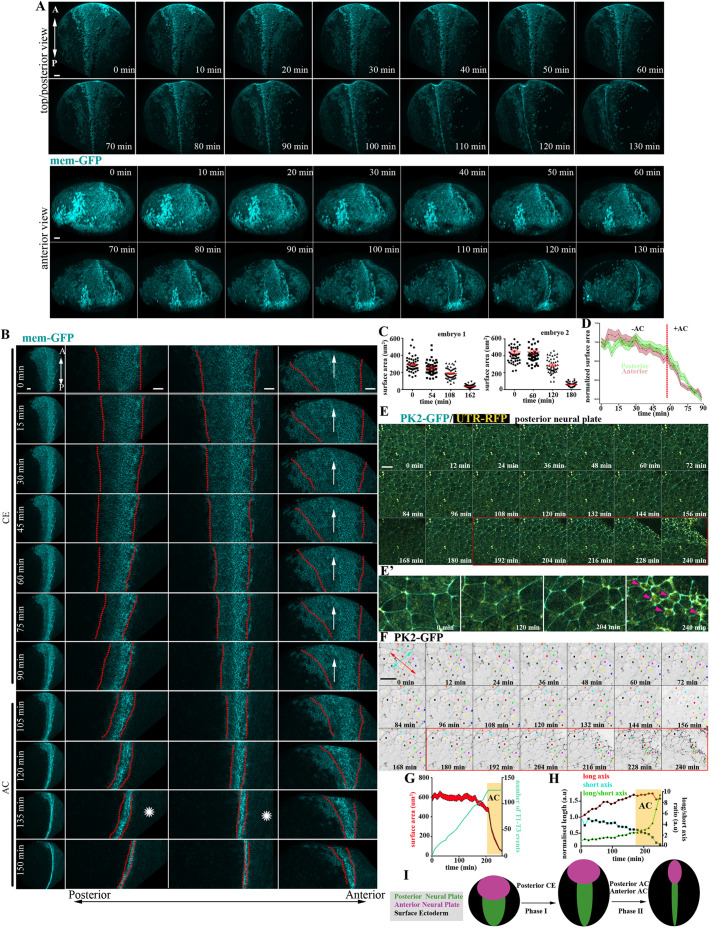
Fig. 4.
AC is initiated subsequent to CE and is the major contributor of NTC the anterior region. (A) Stills from a 3D-rendered, time-lapse recording of a neurula-stage embryo. Scale bars: 100 µm. (B) Stills from a time-lapse recording of a second neurula-stage embryo. In the left column, the entire embryo is shown. The next three columns show zoomed NP areas (posterior to anterior, from left to right). CE at the posterior NP precedes AC and is concomitant with the forward displacement (arrow) of the anterior region. Posterior NTC is completed before anterior NTC (asterisks). Scale bars: 100 µm. (C) Quantification of neuroepithelial cell apical cell-surface area of two different embryos. Data are mean±s.e.m.; n=50 cells for all time points except the last time point of embryo 2, which is 35 cells. (D) Quantification of apical cell-surface area of posterior and anterior NP cells shows that AC (rapid reduction of apical surface area) occurs simultaneously at the posterior and anterior NP. n=30 posterior and 30 anterior NP cells. (E) Stills from a time-lapse recording from the posterior region of a neurula-stage embryo. Imaging was initiated at stage 12.5. Red box indicates the period during which AC takes place. Scale bar: 50 µm. (E′) Zoomed images of selected time points from E. Arrowheads indicate the appearance of apical-medial actomyosin during AC. (F) Cell tracking of magnified regions of the images shown in E. Neighbour exchanges (red and yellow cells are an example) only take place before AC initiation (red box). Double-headed arrows were used for the quantification shown in H: red indicates the length of the cell collective at the A/P direction, cyan indicates the length of the cell collective at the ML direction. Scale bar: 50 µm. (G) Quantification of apical cell surface area and T1-T3 transitions over time. Initiation of AC is marked by the yellow box. The coloured area in the graph for the cell surface area represents s.e.m.; n=30 cells for each time point. (H) Quantification of A/P length of cell collective (long axis; red line), ML length of cell collective (short axis; cyan) and the ratio of A/P and ML (long/short axis; green line). A/P length increases through CE until the initiation of AC when it is slightly reduced, indicating the absence of cell intercalative behaviour. The A/P length is dramatically reduced during AC, when the tissue begins to bend towards the midline. (I) Schematic showing the contribution of AC and CE to changes in morphology during NTC. A, anterior; a.u., arbitrary units; P, posterior.

