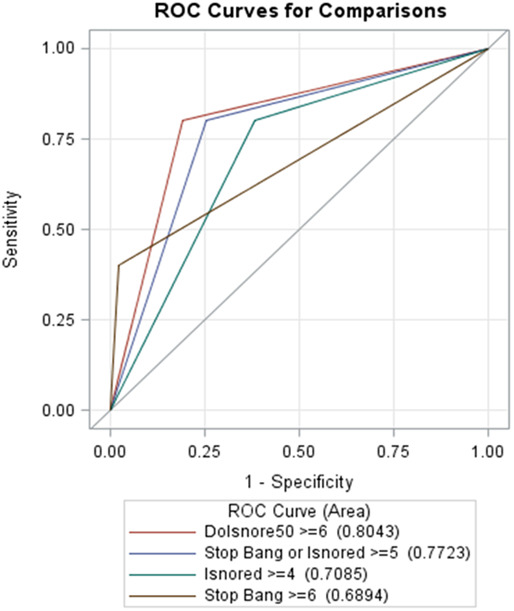
Figure 2. Comparison of ROC curves between DIS, SB, and IS.

ROC curves highlight sensitivity over 1 minus specificity and establish the probability of best performance of DOISNORE ≥ 6 (AUC 0.801), in comparison to SB ≥ 5 (AUC 0.772), or IS ≥ 4 (AUC 0.701). AUC = area under curve, DIS = DOISNORE50, IS = ISNORED, ROC = receiver operating characteristic, SB = STOP-BANG.
