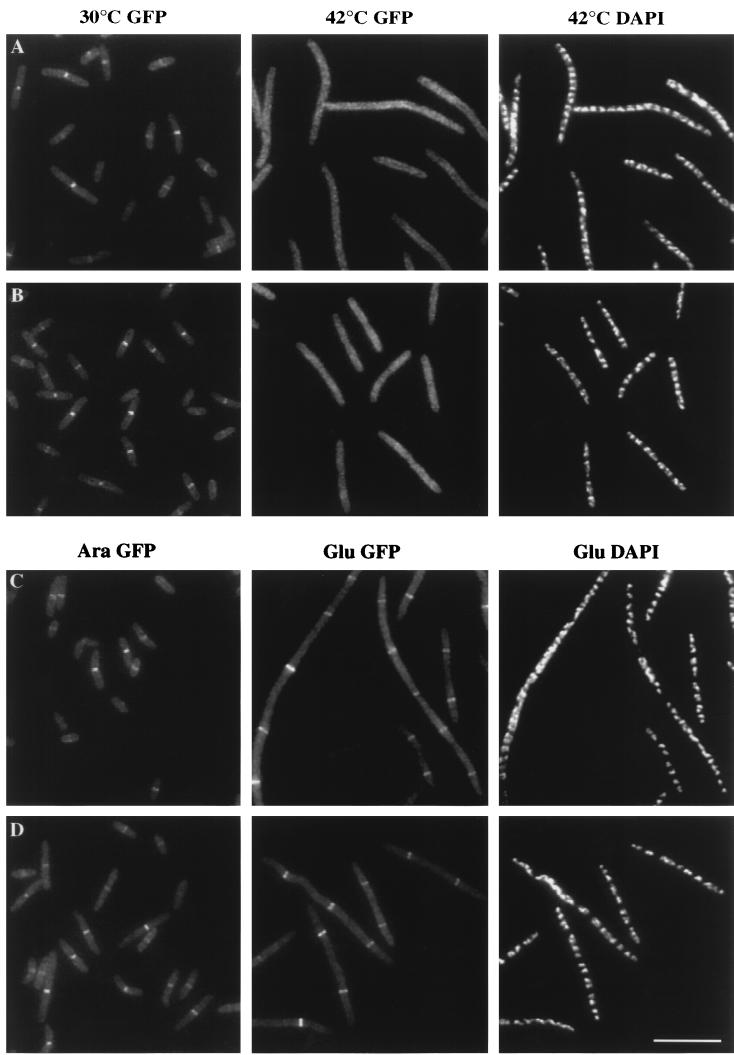
FIG. 3.
Localization of GFP-FtsQ in fts mutants. (A and B) GFP-FtsQ localizes to division sites in ftsZ84(Ts) (A) and ftsA12(Ts) (B) cells at 30°C (left panels) but not at 42°C (middle panels); DAPI images indicate that nucleoid structures are normal in the filaments at 42°C (right panels). (C and D) GFP-FtsQ localizes to potential division sites in FtsI (C) and FtsL (D) depletion strains; the left panels are GFP images of cells growing normally in the presence of arabinose, the middle panels are GFP images of cells grown with glucose and therefore depleted of FtsI or FtsL, and the right panels are corresponding DAPI images of the middle panels. Cells were grown and fixed for fluorescence microscopy as described in Materials and Methods. Strains used were JOE97 (A), JOE95 (B), JOE233 (C), and JOE220 (D). Bar, 10 μm.

