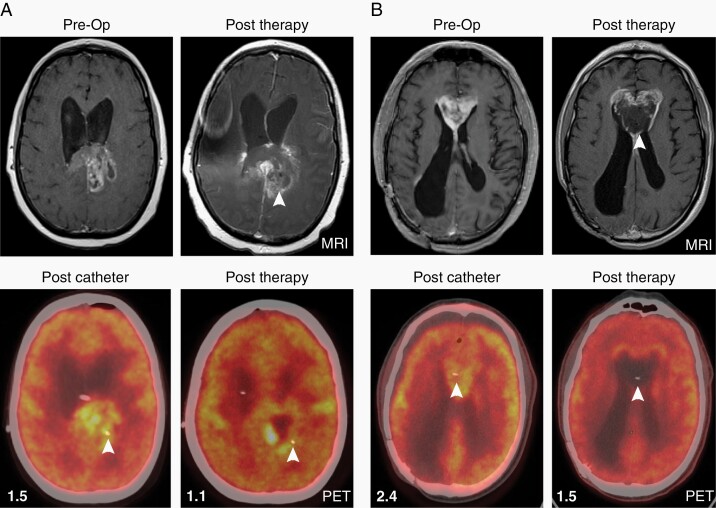
Fig. 4.
Imaging demonstrates increased necrosis near site of CAR T cell injection. Axial T1 with contrast MRI images show preoperative recurrent tumors extending into left splenium of UPN 100 (A) and into the corpus callosum of UPN 104 (B), with PET imaging obtained after catheter placement demonstrating hypermatabolic tumors at each site. One month after treatment initiation (“Post Therapy” panels at right), local necrosis is noted in areas of previous MRI enhancement (white arrow heads); and PET imaging shows hypometabolic tumors, consistent with necrosis, surrounding each catheter site (white arrow heads). Mean standardized uptake values (SUVs) of tumor site normalized to background SUVs are indicated in each PET panel.

