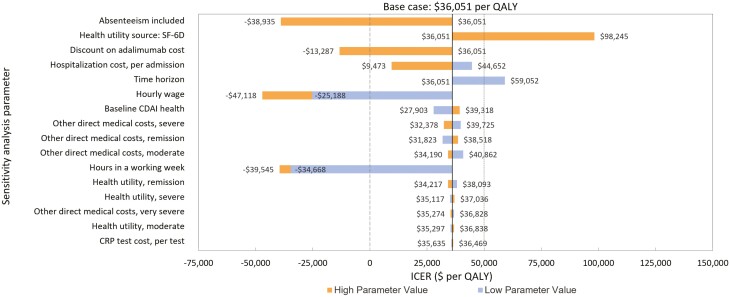
Figure 2.
Results from a one-way sensitivity analysis of base-case analysis. Parameters (refer to Table 2 for values) are presented in descending order of model sensitivity. Bars that do not cross the vertical axis represent parameters with one variable only in the sensitivity analysis. Vertical dashed lines represent thresholds for dominance (long dashed lines) and willingness to pay (short dashed lines). SF-6D values derived from the CALM trial were used in the sensitivity analysis. CALM, Effect of Tight Control Management on Crohn’s Disease; CDAI, Crohn’s Disease Activity Index; CRP, C-reactive protein; ICER, incremental cost-effectiveness ratio; QALY, quality-adjusted life-years; SF-6D, Short-Form 6-Dimension. ∗All costs are in 2020 Canadian dollars.

