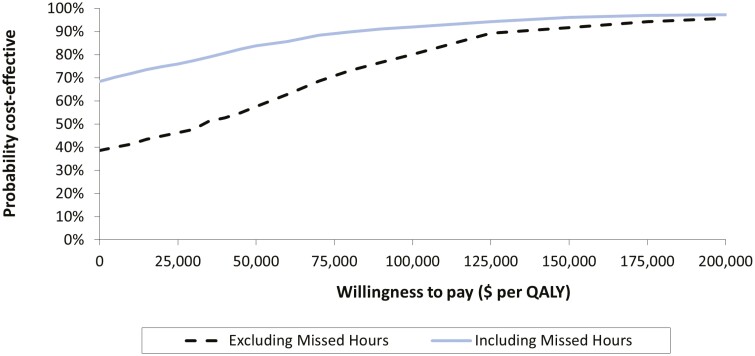
Figure 4.
Cost-effectiveness acceptability curves representing the probability of cost-effectiveness of tight control versus clinical management excluding (reference case) and including absenteeism due to Crohn’s disease, at different willingness-to-pay thresholds. Results are depicted for the analysis excluding absenteeism (hashed lines) and including absenteeism (solid line). Results are based on the probabilistic sensitivity analysis, which included 1,000 second-order Monte Carlo simulations in which model variables were simultaneously varied. Vertical line depicts the $50,000 (dashed lines) willingness to pay threshold per QALY gained. ∗All costs are in 2020 Canadian dollars.

