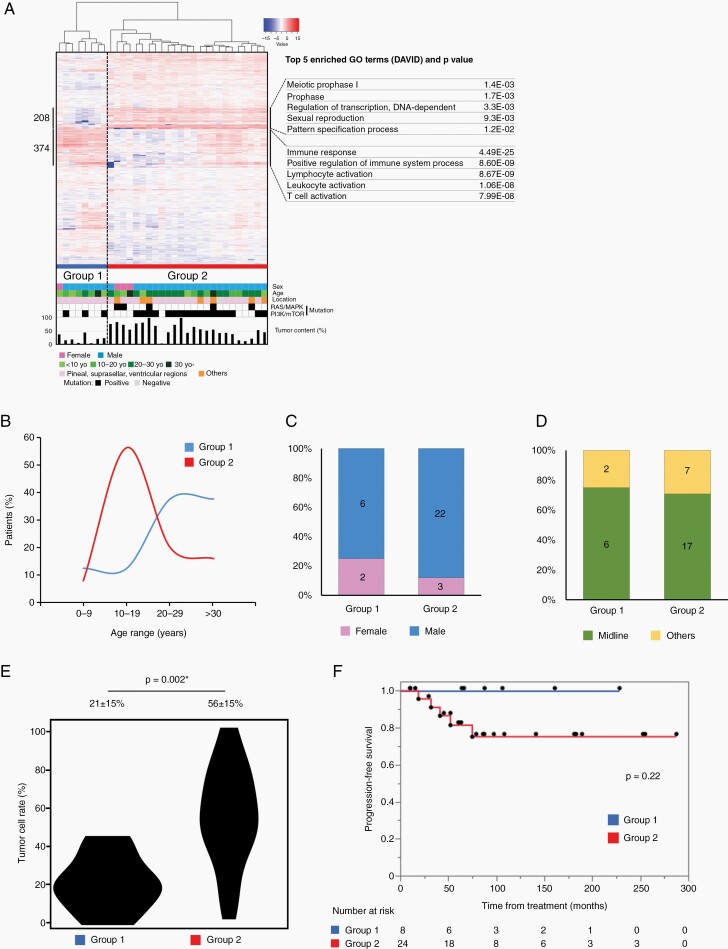
Fig. 2.
(A) Heatmap representation of hierarchical clustering of germinoma cases using the 2084 genes used in Figure 1A. Each row represents a gene, and each column represents a sample. The level of expression (log-transformed RPKM) is represented with a color scale, as described previously. Three groups were named Groups 1 and 2. Highly expressed genes in Group 2 (208) and those in Group 1 (373) were analyzed using DAVID, and their characteristic gene ontology, together with representative genes are described in the right column. (B) Age distribution in each subgroup of germinoma. Group 2 had a peak age at 10–19, while Group 1 showed a peak age at 20 years or older. (C) Differences in gender distribution are not significant between the groups. (D) Tumor location is described as midline structure or other sites. There were no significant differences in the tumor locations based on the groups. (E) Tumor content in each group is indicated with the violin plot. Group 2 had a significantly higher tumor content. (F) Progression-free survival (PFS) in each subgroup was shown using Kaplan–Meier curves. The differences in PFS among these groups were not significant (P = .22, log-rank test); however, Group 1 was better in prognosis. One case (GCT02) was omitted from the analyses for tumor location and prognosis as it lacked this information.

