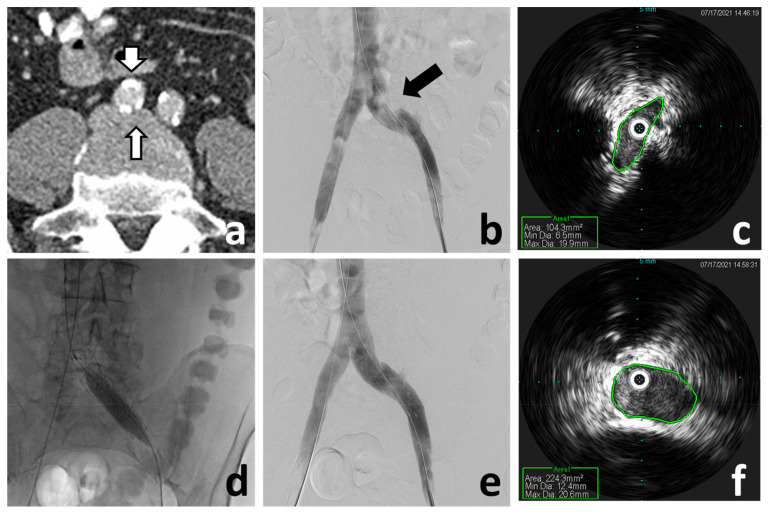
Figure 7. May–Thurner anomaly diagnosis and endovascular treatment.
(a) Abdomen-pelvis computed tomography angiography demonstrates compression of the left common iliac vein (narrow arrow) by a calcific right common iliac artery (wide arrow). (b) Venography demonstrates the external compression of the left common iliac vein (arrow), although it does not accurately represent the severity. (c) Intravascular ultrasound (IVUS) of the left common iliac vein demonstrates the significant lumen reduction (area = 104.3 mm2). (d) Balloon post-dilatation of the deployed left iliac vein stent. Venography (e) and IVUS (f) post-stenting demonstrate correction of the external compression and stenosis (area = 224.3 mm2).

