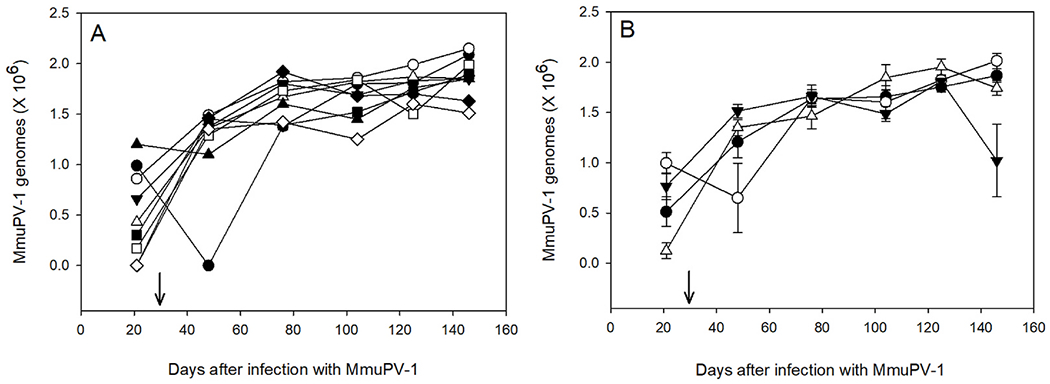
Fig. 4. QPRC analysis of MmuPV1 genomes in oral swabs.

A. Selected MmuPV1-infected mice treated with DBP (Group 1). Each symbol represents a single mouse followed over time for the duration of the study. B. Mean ± SEM of QPCR for mice in group 1 (●), group 3 (○), group 5 (▼) and group 7 (▽). Arrow indicates the beginning of oral treatments with DBP. The infections were also confirmed histologically (Table 1) and in situ hybridization for viral DNA (Fig. 1).
