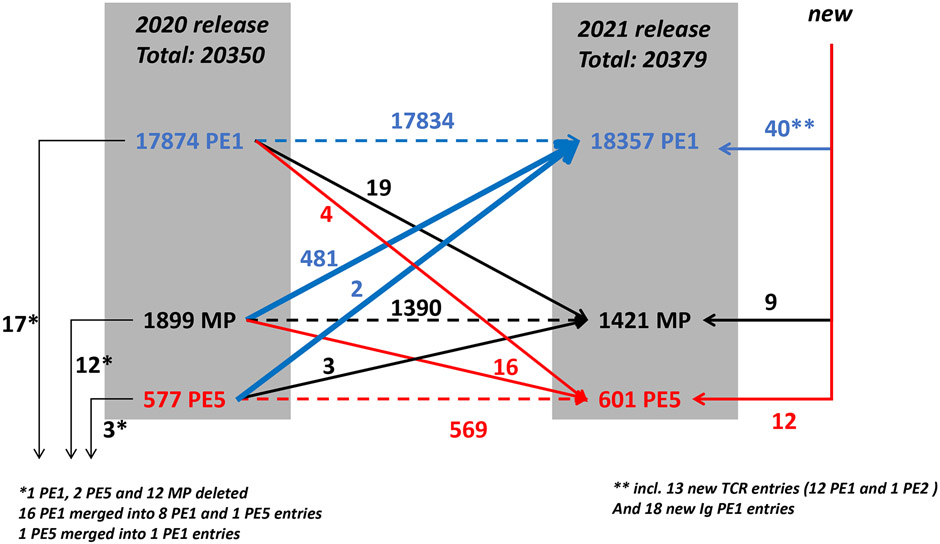
Figure 1.
Flow diagram of changes in numbers of PE 1,2,3,4,5 classes of predicted proteins from 2020-02 to 2021-02 neXtProt release. Blue arrows indicate increases to PE1 (blue); red arrows indicate demotions from PE1 or PE2,3,4 MPs to PE5 (red); black arrows show increases to MPs (black). In the margins are shown new entries to and removals from neXtProt (see text).

