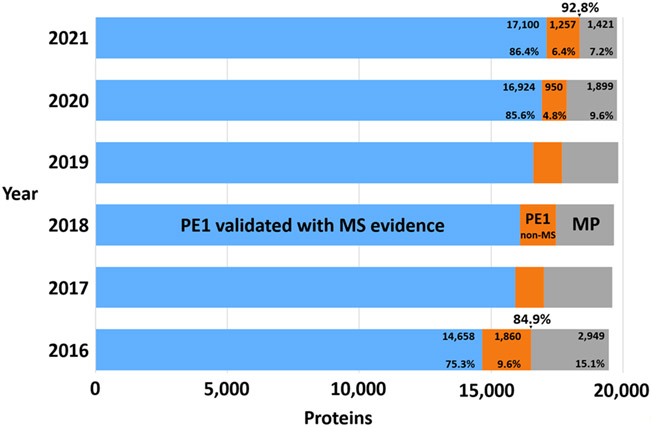
Figure 3.
Bar chart showing the growth in numbers of PE1 proteins based on MS evidence (blue), the initial diminution in numbers of PE1 proteins based on non-MS data (as many of these proteins were identified with MS) with a large increase for 2021 from PPI datasets (orange) (see discussion of Figure 1), and the striking, progressive reduction in PE2,3,4 missing proteins (grey). The numbers 84.9% and 92.8% above 2016 and 2021 represent the percentage of all PE 1,2,3,4 proteins that are PE1.

