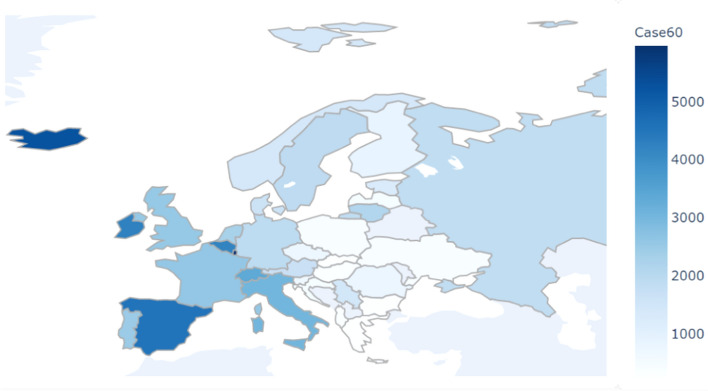
Fig. 5.
Early-stage transmission outcomes of European countries. Note: The figure was generated in Python. The colored tape in the right part of the figure indicates the total confirmed cases per million capita 60 days after a country's daily cases reached 0.1 per million capita (variable Case60). The data used are taken from JHU CCSE (https://github.com/owid/covid-19-data)

