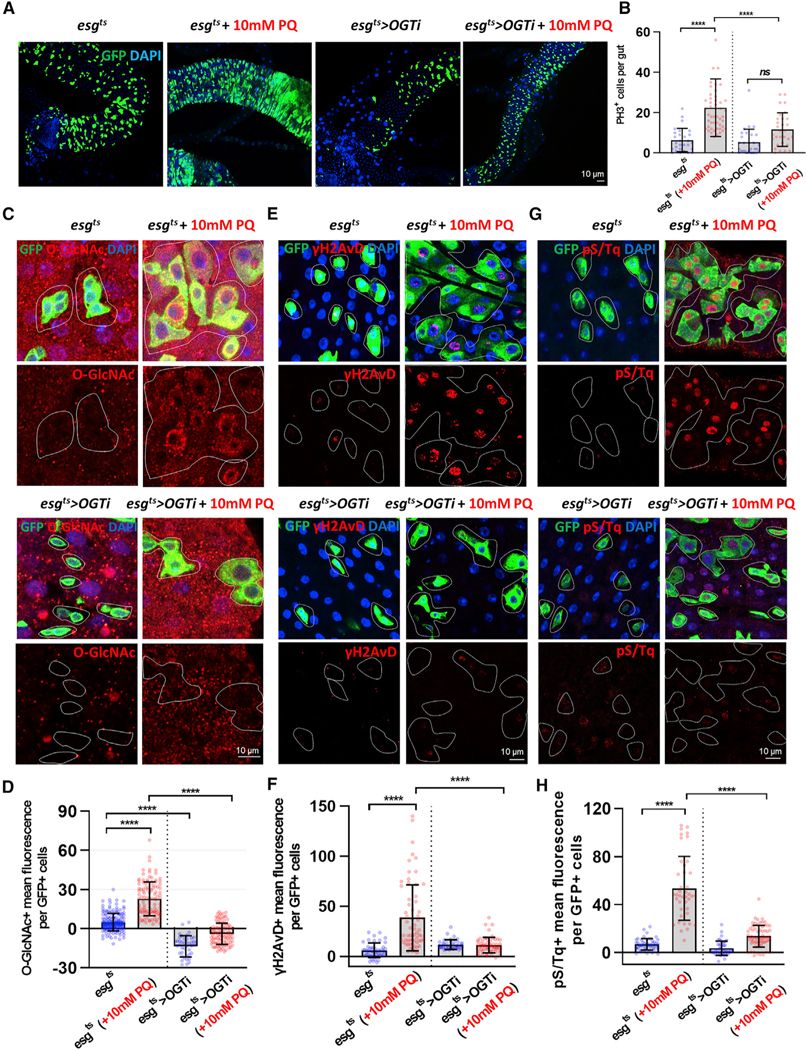
Figure 4. Oxidative-Stress-Induced DDR and Proliferation in ISCs/EBs Required OGT.
(A) After 6 days of induction at 29C, immunofluorescence staining of esg-GFP (green) in midguts of esgts>+ and esgts>OGTRNAi transgene flies followed by treatment with 10 mM PQ in 5% sucrose or 5% sucrose alone for 20 h at 29°C.
(B) The number of PH3-positive cells in midguts from flies.
(C) Immunofluorescence staining images of O-GlcNAc (red) in esg-GFP-positive cells (green) in midgut of flies from the indicated genotype and treatment.
(D) Quantification of O-GlcNAc mean fluorescence per esg-GFP-positive cell.
(E) Immunofluorescence staining of γH2AvD (red) in midgut of flies from the indicated genotype and treatment.
(F) Quantification of γH2AvD mean fluorescence per esg-GFP-positive cell.
(G) Immunofluorescence staining of pS/Tq (red) in midgut of flies from the indicated genotype and treatment.
(H) Quantification of pS/Tq mean fluorescence per esg-GFP-positive cell.
Outline indicates esg-positive cell boundary. Data are represented as mean ± SD. ****p < 0.0001. n.s., not significant; see Table S1 for N values.

