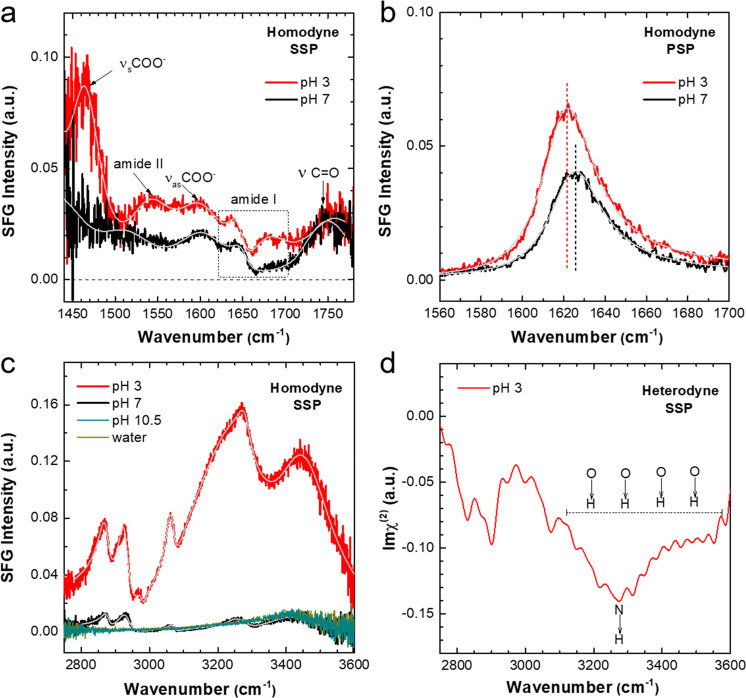
Figure 2.
(a) Homodyne SSP SFG spectra in the frequency region 1440–1800 cm–1 for Aβ16–22 peptides at the air–water interface with bulk solution pH of 3 (red) and 7 (black). Characteristic bands from backbone and side chains are marked. (b) Homodyne PSP SFG spectra in amide I region for interfacial peptides at pH 3 (red) and 7 (black). (c) Homodyne SSP SFG spectra in CH/OH region for Aβ16–22 peptides at air–water interface with solution pH of 3 (red), 7 (black), and 10.5 (cyan). The spectrum for pure water (dark yellow) is included as reference, and is indistinguishable from the pH 10.5 spectrum. (d) Heterodyne SSP SFG spectra in CH/OH region for interfacial peptides at pH 3. In parts a–c, the spectra fits (gray) were superimposed into experimental homodyne spectra.

