
Figure 1. APOE genotype and haplotype-based brain cell type model.
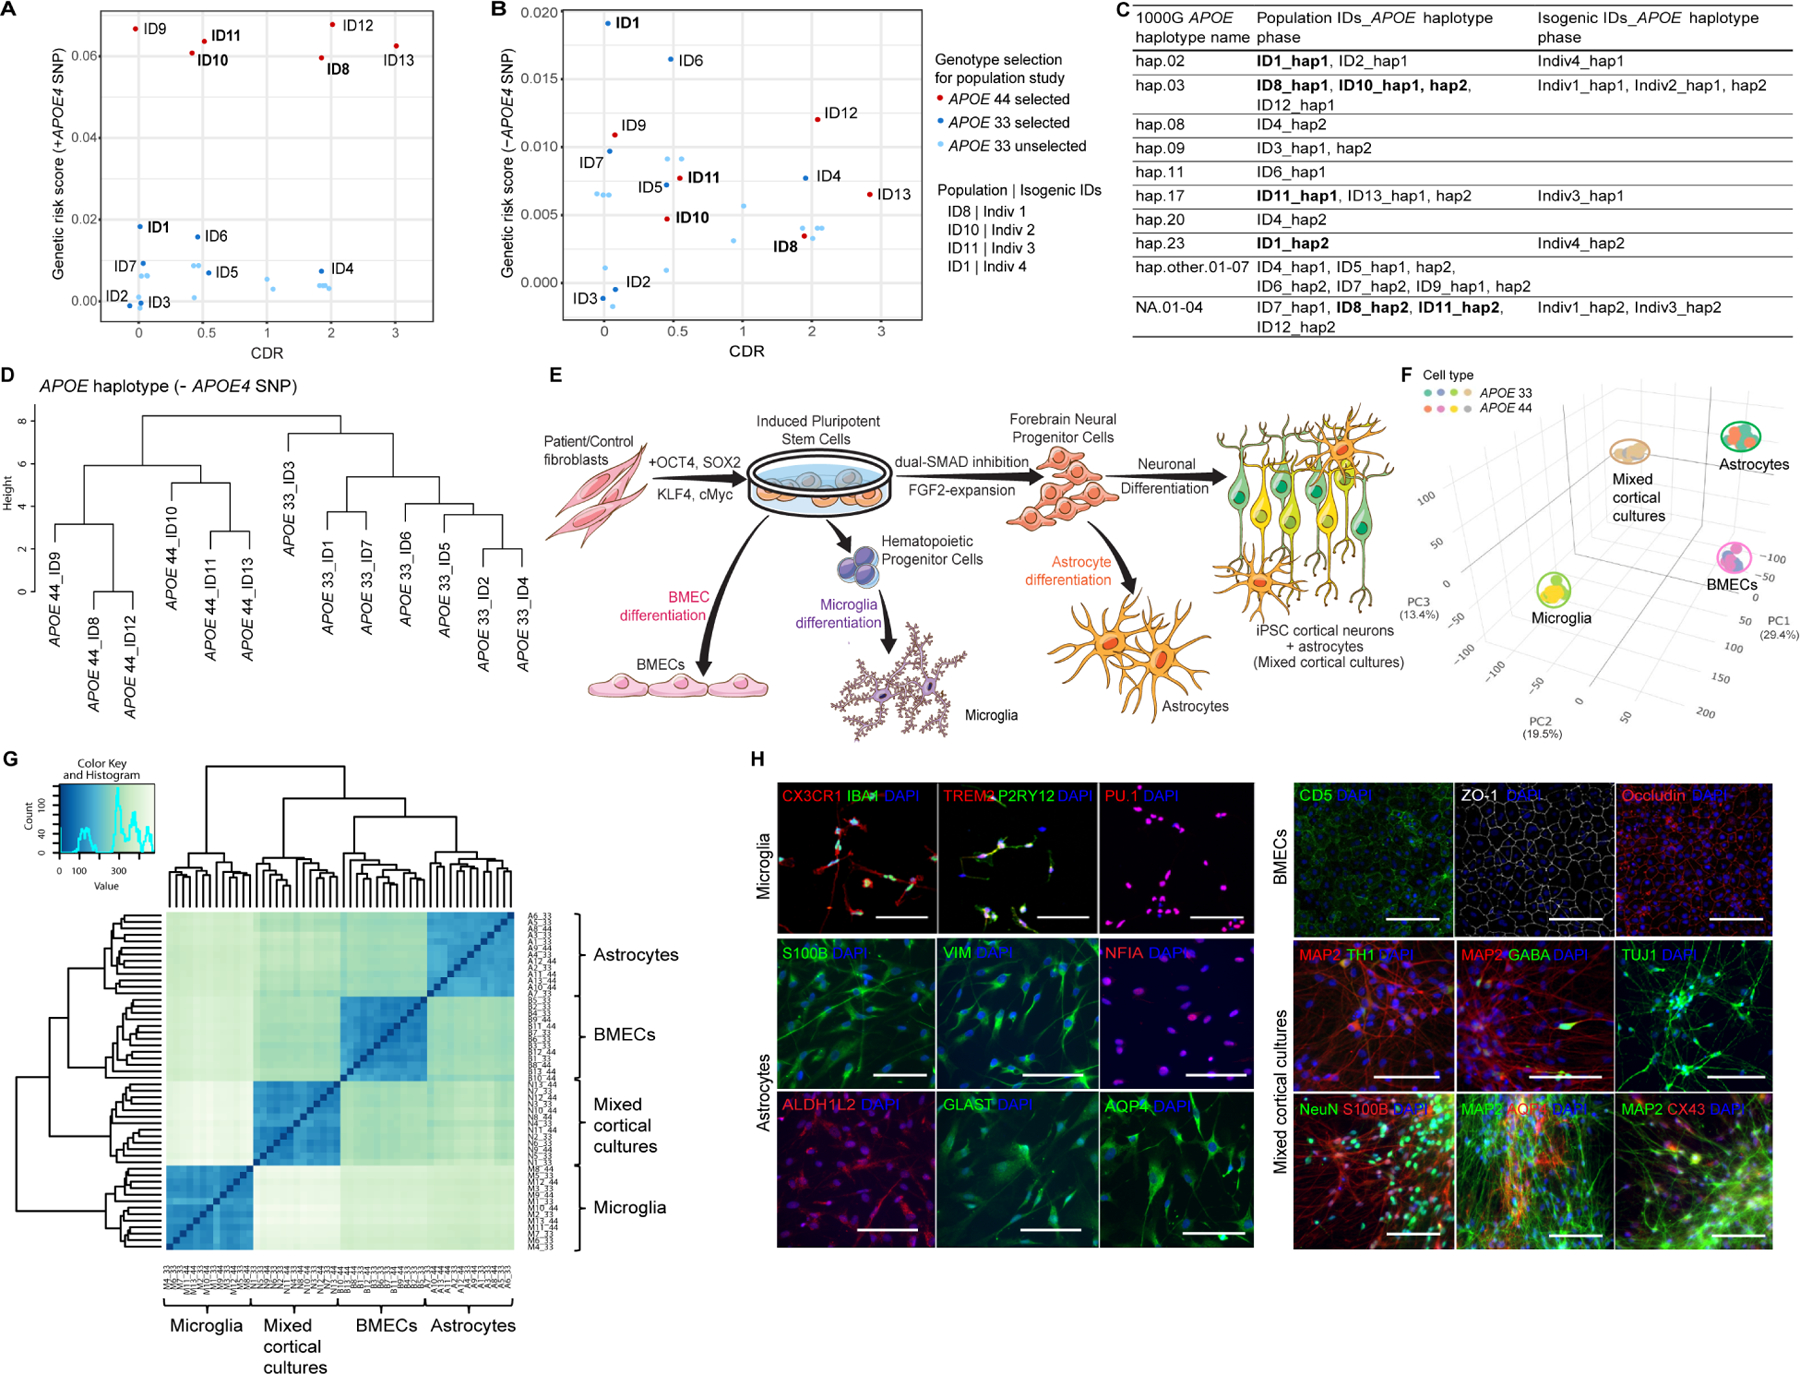
(A-B) GRS analysis with (A) or without (B) APOE4 SNP in 43 APOE iPSC lines. Labeled IDs for the population model, bolded IDs for the isogenic model. CDR, clinical dementia rating. See Table S1 for phenotypes.
(C) APOE local haplotype analysis of population (N=13) and isogenic (N=4) hiPSC lines after haplotype phasing referenced to 1000G (N=399). Bold IDs represent isogenic lines. See Table S1, S5 and S9 for detail.
(D) Hierarchical clustering analysis of APOE local haplotype without APOE4 SNP in population lines.
(E) Schematic of mixed cortical cultures, astrocytes, microglia and BMECs differentiated from APOE hiPSCs.
(F-G) PCA (F) and Spearman correlation analysis (G) of the whole transcriptome from 52 differentiated samples (N=13/cell type).
(H) Representative immunofluorescent images of microglia, astrocytes, BMECs and mixed cortical cultures markers. Scale bar=100μm.