
Figure 2. Enriched lipid and matrisome pathways by APOE4 in population model.
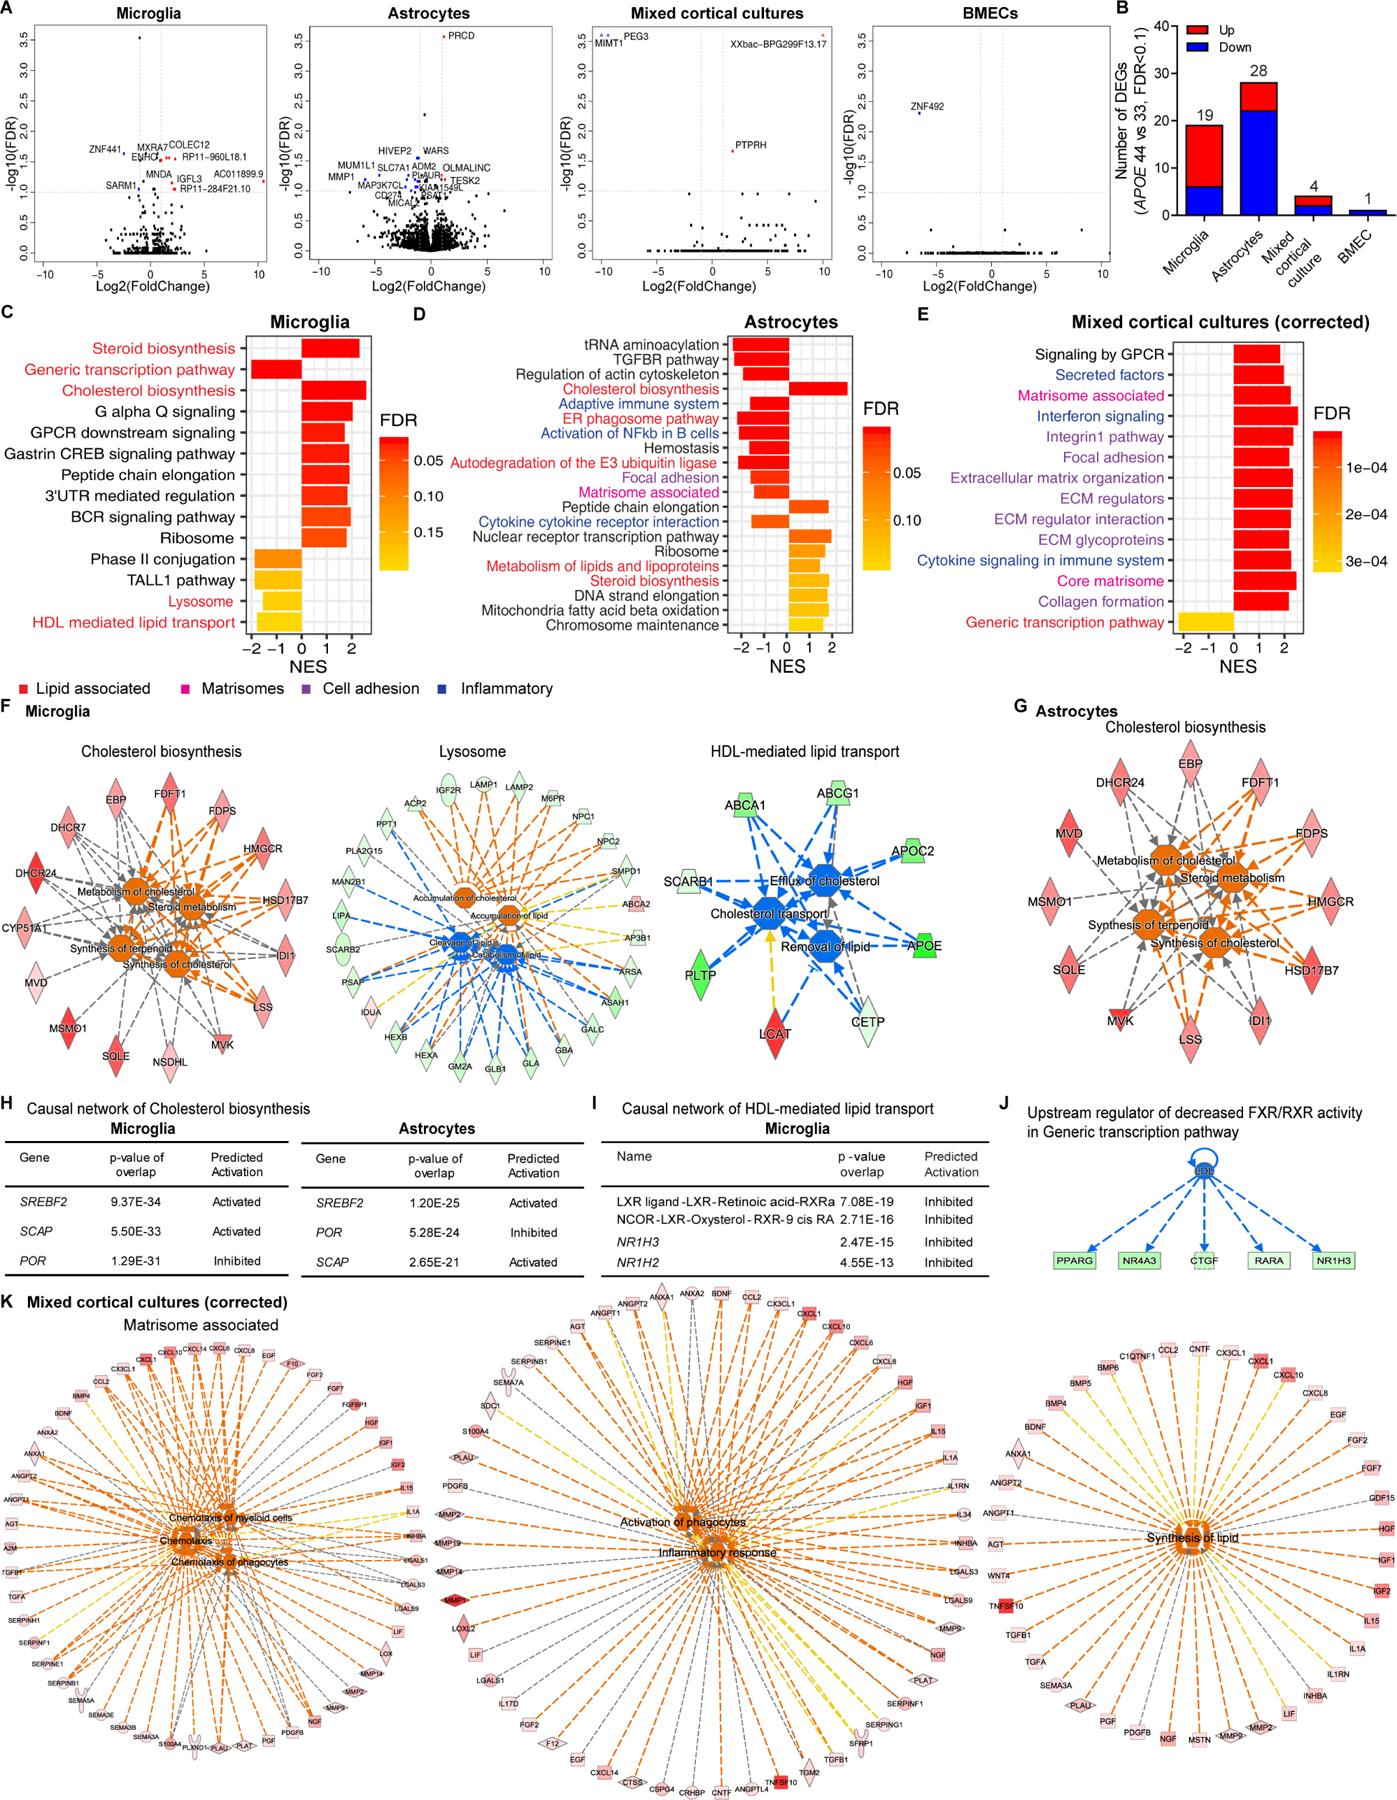
(A) Volcano plots of APOE4 vs. APOE3 in each cell type. Gene names labeled by >|2| fold change, FDR<0.1.
(B) The number of significant DEGs in each cell type.
(C-E) Top significant pathways from fGSEA of APOE4 vs. APOE3 in microglia (C), astrocytes (D) mixed cortical cultures after cell type proportion correction (E).
(F) Functional pathway analysis of Cholesterol biosynthesis, Lysosome and HDL-mediated lipid transport from fGSEA enriched in APOE4 microglia. Red/orange: upregulated, green/blue: downregulated genes/functions. See Table S2 for functional pathway statistics.
(G) Functional pathway analysis of Cholesterol biosynthesis in APOE4 astrocytes.
(H) Causal network analysis of Cholesterol biosynthesis in APOE4 microglia and astrocytes.
(I) Causal network analysis of HDL-mediated lipid transport in APOE4 microglia.
(J) Upstream regulator of downregulated FXR/RXR activity in APOE4 microglia.
(K) Functional pathway analysis of Matrisome associated in APOE4 mixed cortical cultures after proportion correction. See Table S3 for functional pathway statistics.