
Figure 7. Actin cytoskeleton and matrisome dysregulation in APOE4 mixed cortical culture astrocytes.
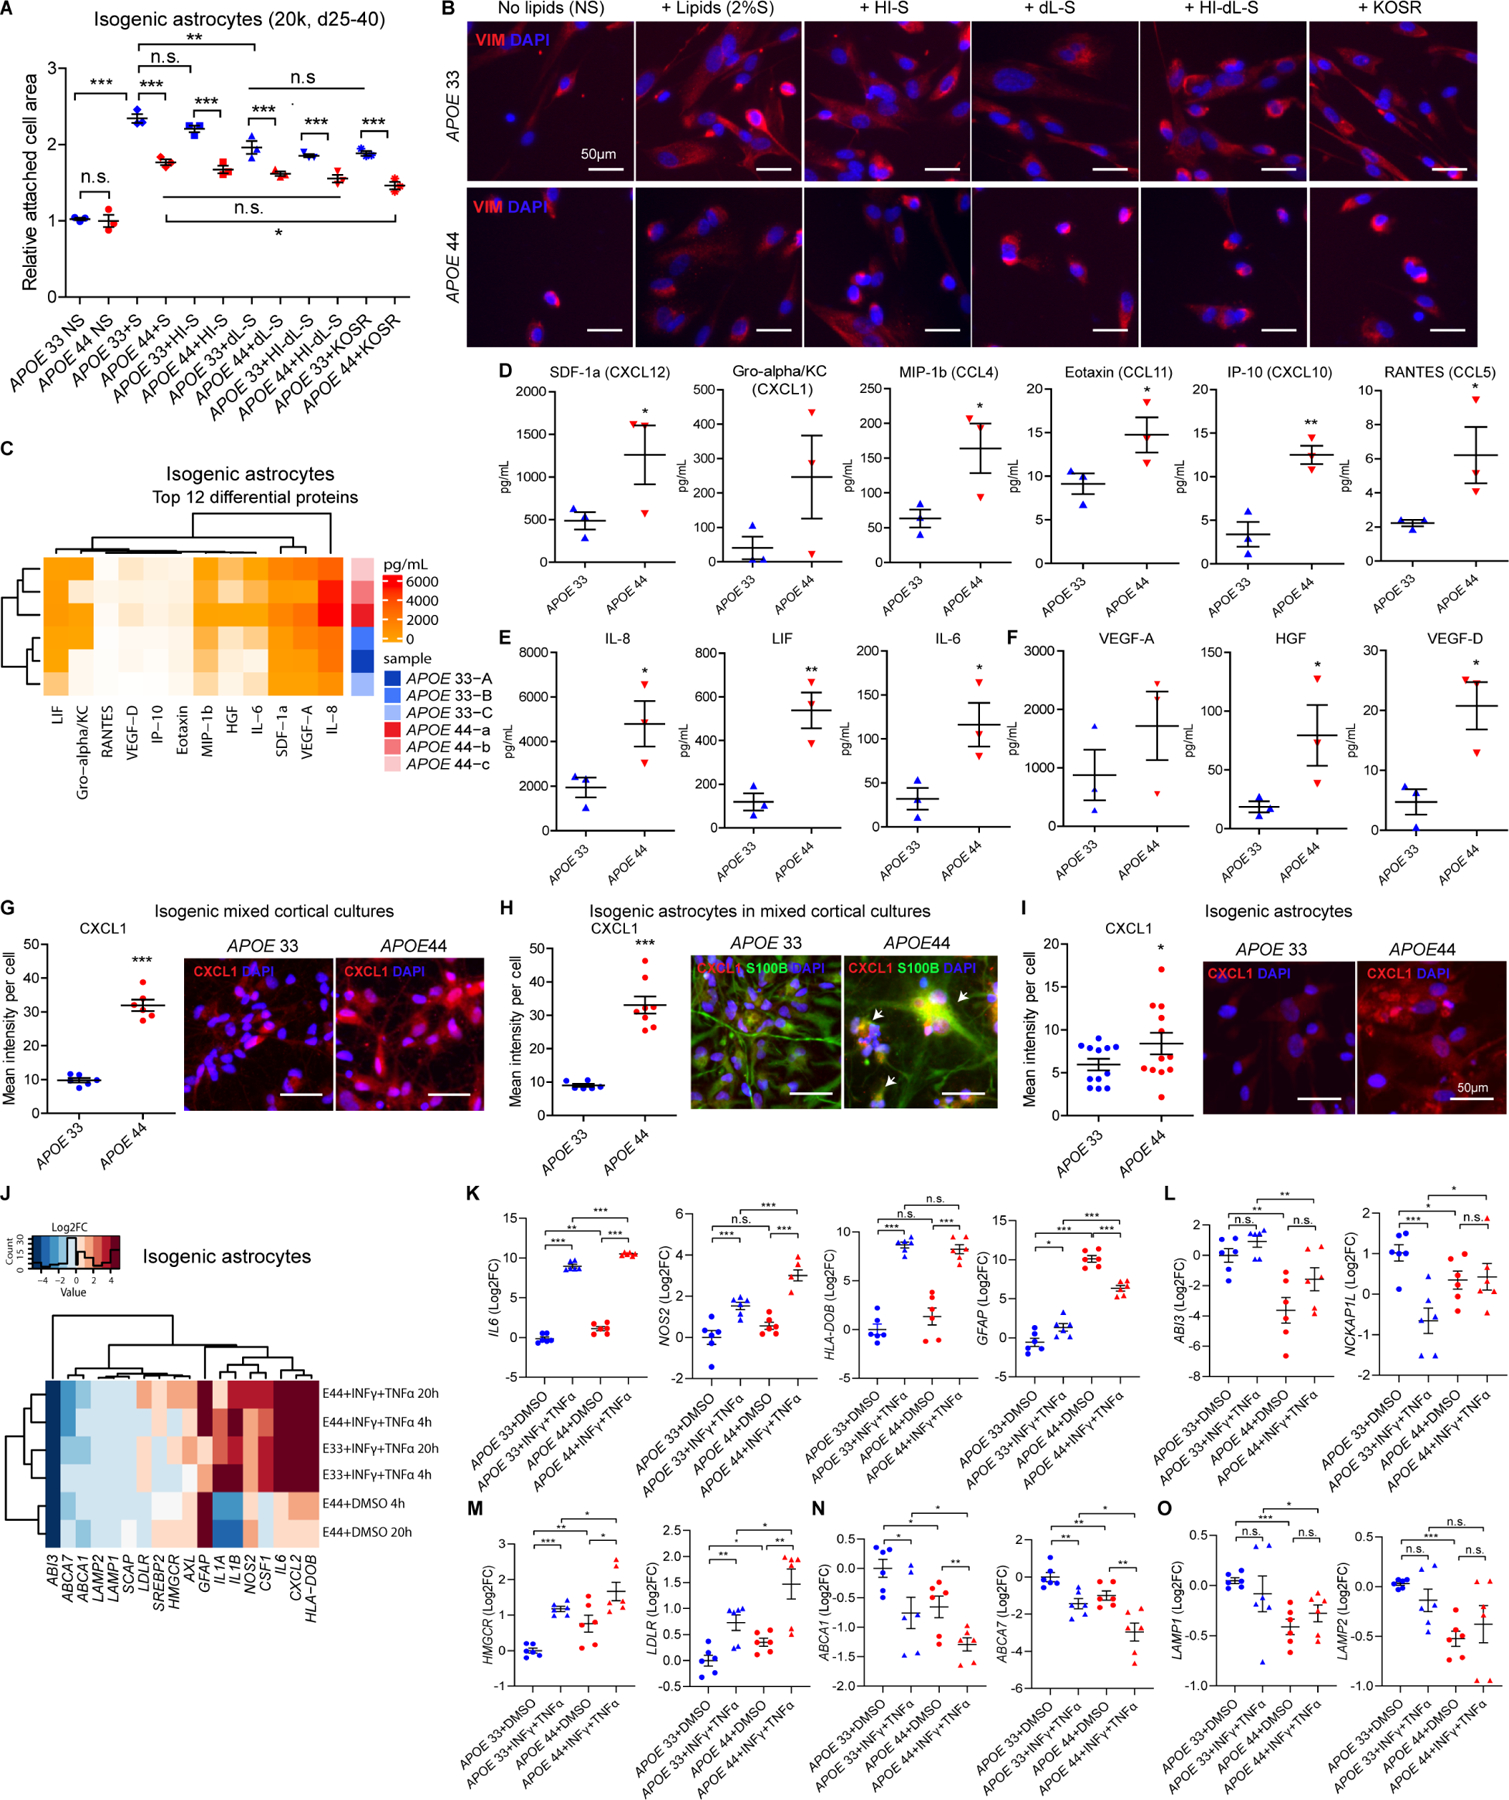
(A) Relative attached cell area on the surface measured by whole cell masks in isogenic APOE astrocytes with no serum (NS), serum (S), heat-inactivated serum (HI-S), delipidated serum (dL-S), heat-inactivated delipidated serum (HI-dL-S) and knockout serum replacement (KOSR).
(B) Representative VIM images in isogenic APOE astrocytes with NS, S, HI-S, dL-S, HI-dL-S and KOSR.
(C) Clustering heatmap for top 12 secreted proteins from 45-plex human panel 1 in isogenic APOE astrocytes (N=6, A-C, a-c, isogonics lines, 2 independent experiments, 3 replicates).
(D-F) Quantification of chemokines (D), cytokines (E) and growth factors (F) secreted by isogenic APOE astrocytes. (N=6, each dot=2 experiments).
(G-I) Representative images and quantification of chemotaxis marker, CXCL1 in isogenic APOE mixed cortical cultures (G), astrocyte ROIs in mixed cortical cultures (H) and pure astrocytes (I) (N=12).
(J-O) Clustering heatmap for representative genes (J) and relative expressions of matrisome (K), actin cytoskeleton (L), cholesterol biosynthesis (M), cholesterol efflux (N) and lysosome (O) in isogenic APOE astrocytes with or without proinflammatory activators (INFγ+TNFα) or vehicle controls (DMSO) for 4h and 20h. One-way unpaired t-test for genotype comparisons, Two-way ANOVA with Bonferroni post-hoc corrections for comparisons of multiple treatments. *, p<0.05, **, p<0.01, ***, p<0.001, n.s., not significant, Error bars=SEM