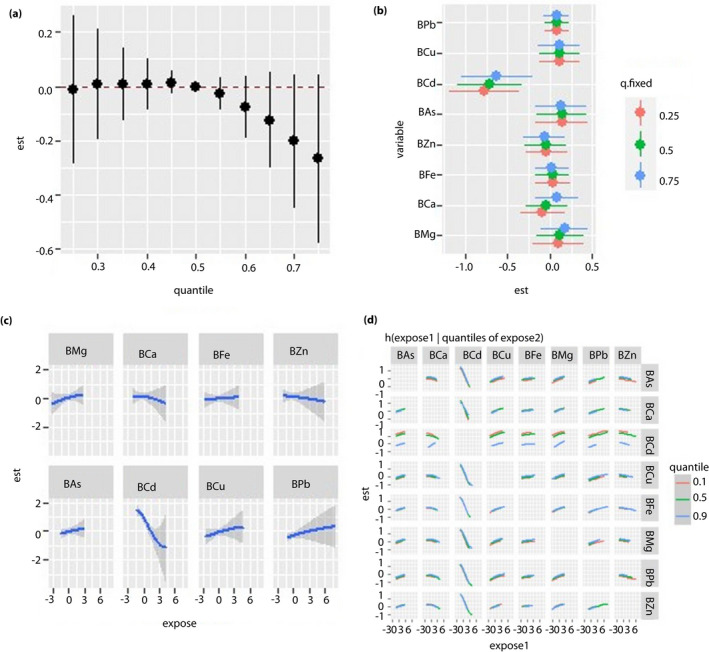
Figure 3.

Regression analysis between blood metal and fasting blood glucose (FBG) levels in the cadmium‐polluted area. All the models have been adjusted for age, sex, body mass index and smoking status. ‘Est’ stands for ‘estimate’, which means that the estimates of the effects include the overall, individual and interactive effects of different metals on FBG when the metal levels change. ‘Expose’ stands for metal exposure levels. Here, we use the z‐score for all the exposures to have the same scale. (a) Overall effects of mixed‐metal exposure: the variation of FBG when all the metals are at a particular quantile compared with when all of them are at their median value. (b) Contribution of single‐metal exposure to the overall effects: the variation of FBG when a single metal is at the 75th percentile compared with when it is at its 25th percentile, and all of the remaining metals are fixed at either the 25th, 50th or 75th percentile. (c) Univariate exposure–response function: the univariate relationship between each metal and FBG when all of the other metals are fixed at the 50th percentile. (d) Bivariate exposure–response function: the exposure–response function of a single metal when the second metal is fixed at either the 10th, 50th or 90th percentile and the remaining metals are fixed to a particular value. BAs, concentration of arsenic in the blood; BCa, concentration of calcium in the blood; BCd, concentration of cadmium in the blood; BCu, concentration of copper in the blood; BFe, concentration of iron in the blood; BMg, concentration of magnesium in the blood; BPb, concentration of lead in the blood; BZn, concentration of zinc in the blood.
