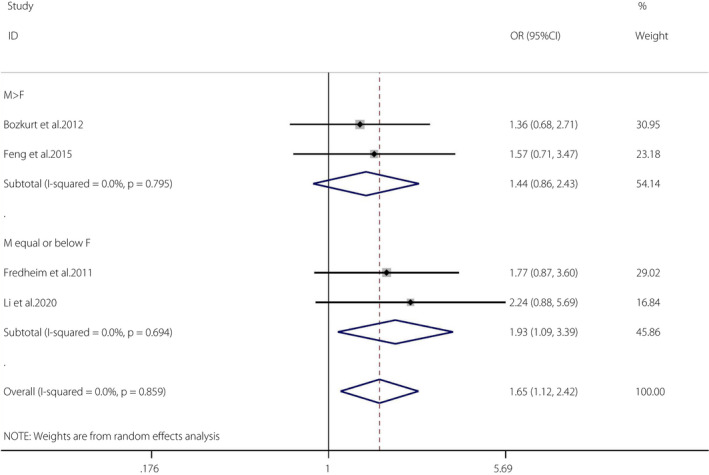
Figure 4.

Obstructive sleep apnea and the prevalence of impaired glucose regulation. A forest plot illustrating the meta‐analysis results of the prevalence of impaired glucose regulation in people with obstructive sleep apnea and non‐obstructive sleep apnea. CI, confidence interval; F, female; M, male.
