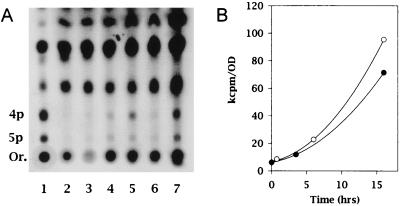
FIG. 2.
Guanosine polyphosphates in H. pylori NCTC11637. (A) (p)ppGpp in growing and amino acid-starved cells. Lane 1, control (S. typhimurium TA997), 10 min after addition of PA; lanes 2 to 5, H. pylori 0, 45 min, 6 h, and 16 h after addition of PA, respectively; lanes 6 and 7, H. pylori control samples 3.5 h and 16 h after time 0, Abbreviations: Or., origin; 5p, pppGpp; 4p, ppGpp. (B) Basic ppGpp levels in H. pylori NCTC11637. The spots corresponding to ppGpp on the polyethyleneimine-cellulose chromatograms from the experiment shown in panel A were counted with a PhosphorImager scan analysis apparatus. The counts were normalized to the corresponding optical densities at 600 nm (OD). Experiments were performed during either exponential growth (solid circles) or starvation for isoleucine (open circles). The computer-generated image shown in panel A was acquired with Adobe Photoshop 4.0 software on a Umax Astra 1200 scanner.

