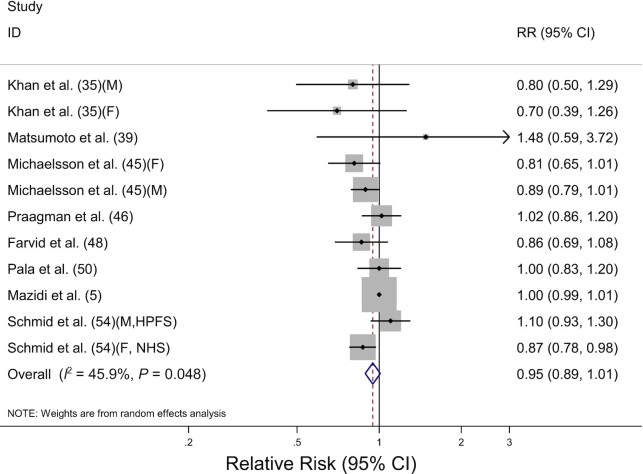
FIGURE 4.
Forest plot of total cancer mortality for the highest compared with lowest categories of fermented milk consumption. The sizes of the squares correspond to the inverse of the variance of the natural logarithm of the RR from the individual study, and the diamond indicates the pooled RR. F, female; HPFS, Health Professionals Follow-up Study; M, male; NHS, Nurses’ Health Study.

