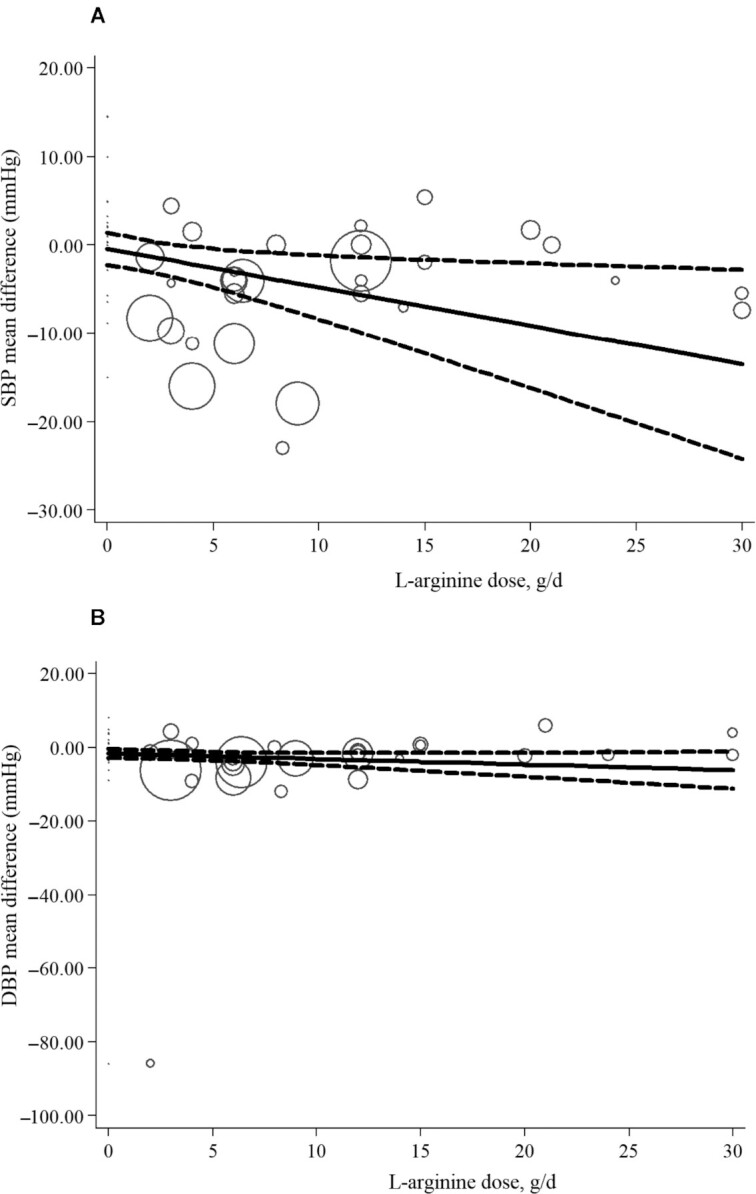
FIGURE 3.

Nonlinear dose–response analysis of the effects of l-arginine dose on SBP (A) and DPB (B) in adults (REMR model analysis). Individual trials are represented by circles, with their weight in the overall analysis represented by circle size. The solid lines represent the estimated dose-response for l-arginine supplementation on (A) SBP, (B) DBP. The dashed lines represent 95% CI. DBP, diastolic blood pressure; REMR, robust error meta-regression; SBP, systolic blood pressure.
