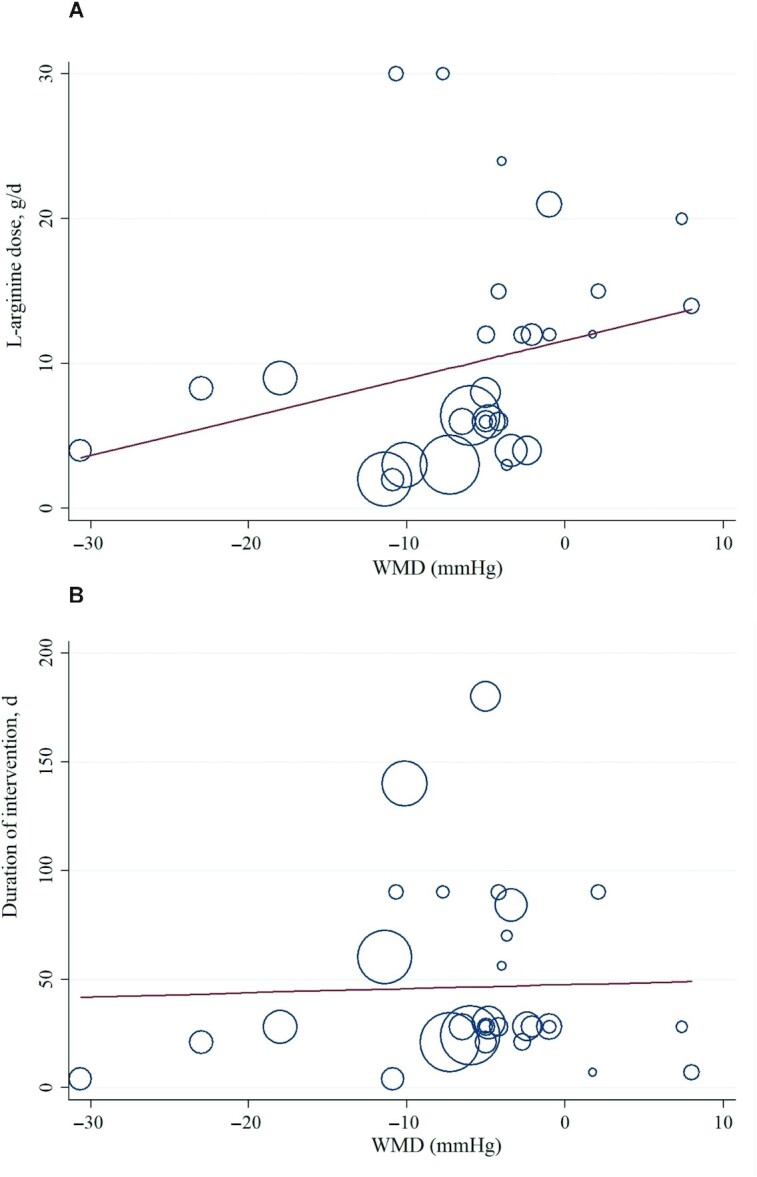
FIGURE 4.

Random-effects meta-regression plots of the associations between dose of l-arginine (A) or duration of intervention (B) and WMD of SBP in adults. Line show linear prediction; each trial is represented by a circle that shows the actual coordinates (observed effect size by latitude) for that study. The size (specifically, the area) of each circle is proportional to that study’s weight in the analysis. SBP, systolic blood pressure; WMD, weighted mean difference.
