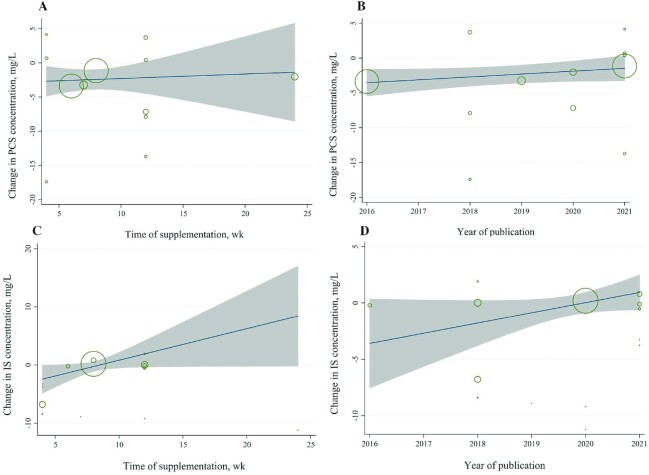
FIGURE 5.
Meta-regression plot. (A, B) Change in PCS concentration according to (A) supplementation time of microbiota-driven therapy and (B) year of publication. (C, D) Change in IS concentration according to (C) supplementation time of microbiota-driven therapy and (D) year of publication. IS, indoxyl sulfate; PCS, p-cresyl sulfate.

