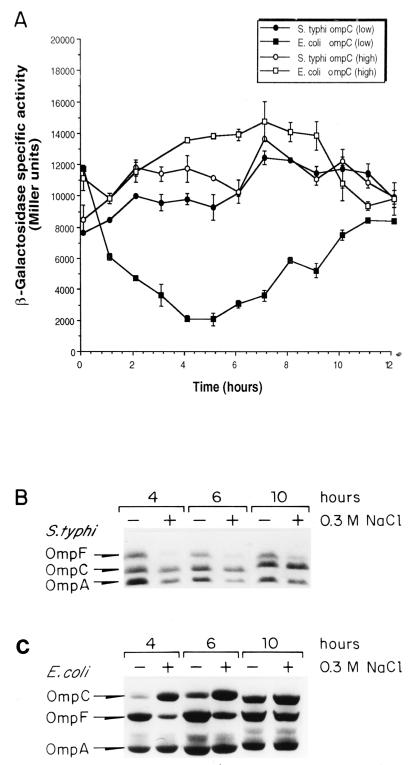
FIG. 1.
Kinetics of E. coli or S. typhi ompC and ompF expression throughout the growth curve. (A) S. typhi IMSS-1 carrying plasmid pSCZ10 (S. typhi ompC-lacZ fusion; circles) and E. coli MC4100 carrying plasmid pECZ20 (E. coli ompC-lacZ fusion; squares) were grown in medium A with (open symbols) or without (closed symbols) 0.3 M NaCl (high or low osmolarity, respectively). β-Galactosidase activity was measured from samples taken hourly from duplicate cultures. The data represent the average of three different experiments. (B) S. typhi IMSS-1 and E. coli MC4100 were grown at 37°C in medium A with (+) or without (−) 0.3 M NaCl (high or low osmolarity, respectively); OMPs were purified from samples taken hourly and subjected to SDS-PAGE for S. typhi or to urea-SDS-PAGE for E. coli. Strains carrying deletions in either ompC or ompF were used to ascertain the positions of both porins (see Materials and Methods and Fig. 3). Data for OMPs at 4, 6, and 10 h are shown.

