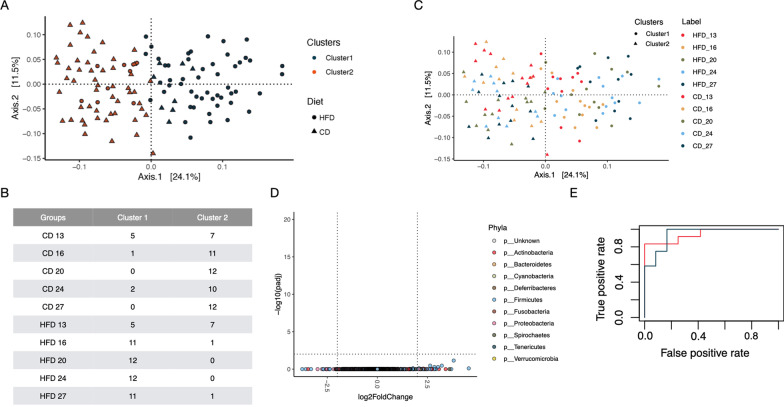
Fig. 5.
Differences between groups and between time points within each group. A Partitioning around medoids clustering of fecal microbiota using the top two PCoA axes (Fig. 4) revealed dogs in this study can be partitioned into two clusters (blue and red). B–C Cluster 1 contained primarily time points from the high-fiber diet (HFD) and Cluster 2 was enriched with time points from the protein-rich canned diet (CD). At the start of the trial (i.e., d 13), however, individuals were almost evenly split between the two clusters. This agrees with DESeq that showed no differences in genus abundance between the two diet groups at d 13 (D). E Moreover, a random forest (RF) classifier accurately differentiated the microbial compositions by diet

