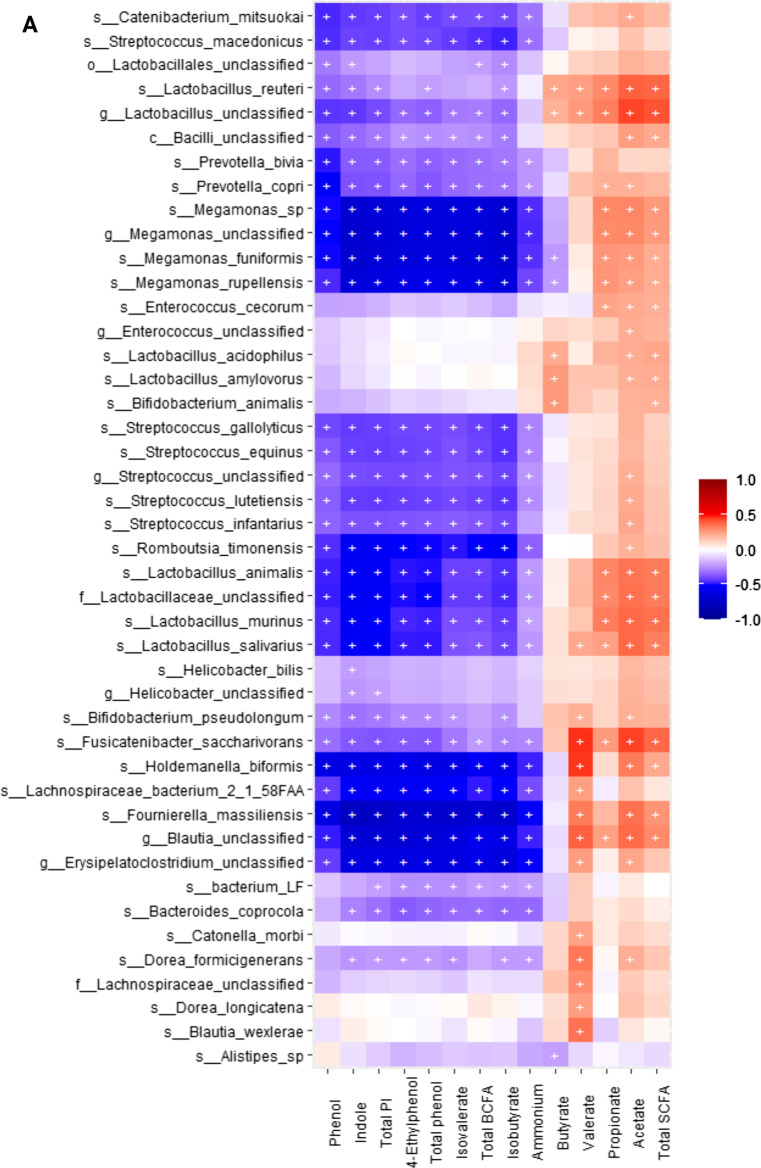
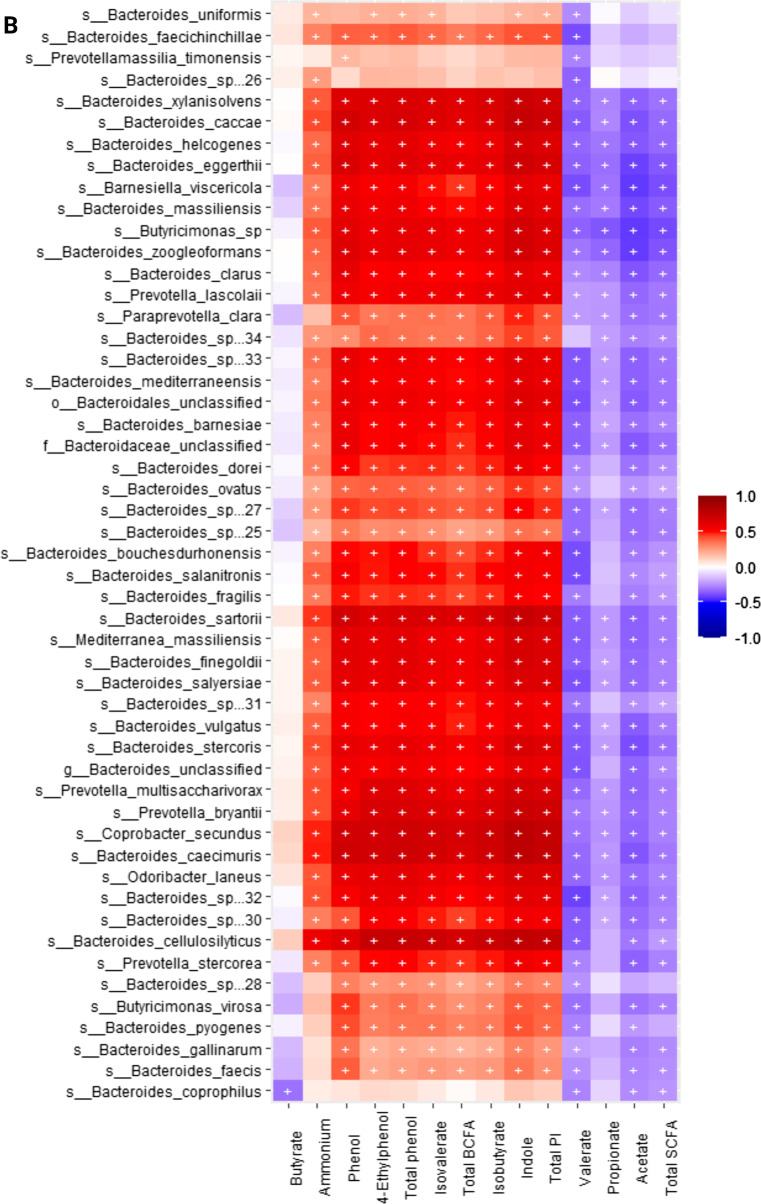
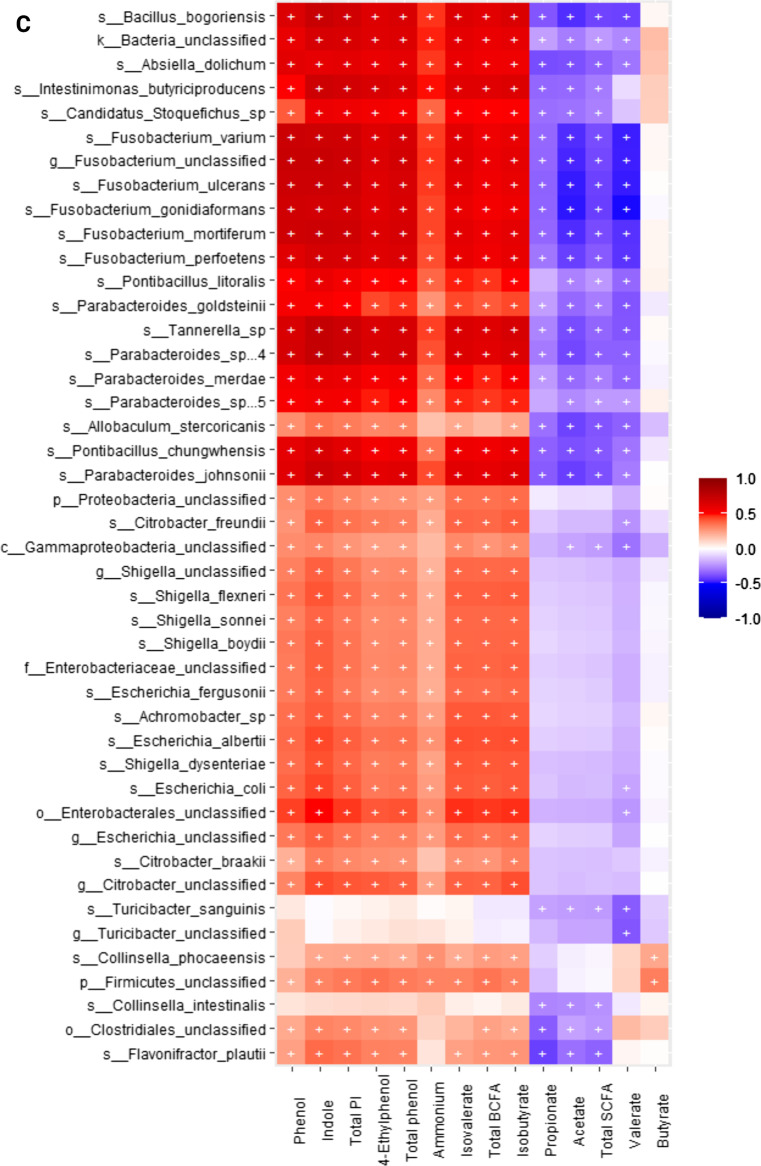
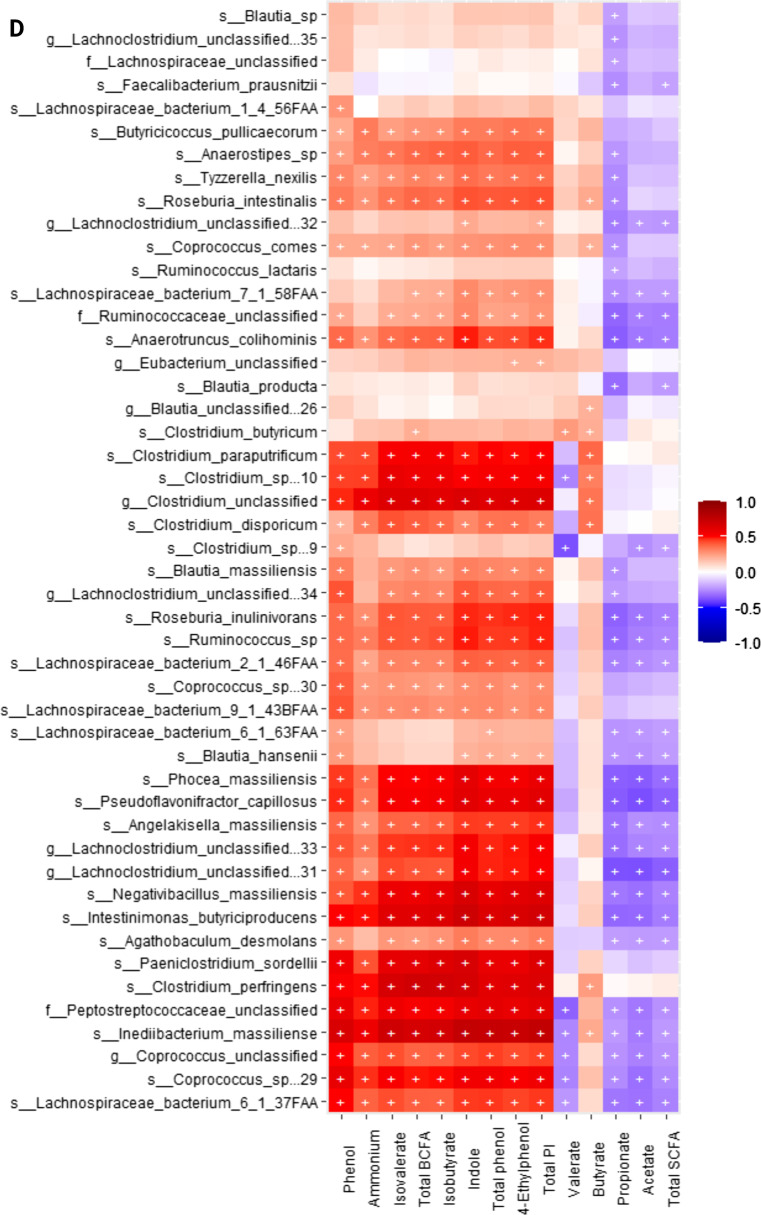
Fig. 9.
Heatmap of significant correlation values (r) between fecal microbial species and fecal metabolites. A Bacteria that primarily had a negative correlation with phenols, indoles and branched-chain fatty acids (BCFA; products of protein fermentation) and a positive correlation with short-chain fatty acids (SCFA; products of carbohydrate fermentation). B-D Bacteria that primarily had a positive correlation with phenols, indoles, and BCFA and a negative correlation with SCFA. The X and Y axes of the thermal graph are the metabolites and species, respectively. R values are represented by different colors (red: positive; blue: negative). Significant correlations (adj P < 0.05) are indicated by ‘+’


