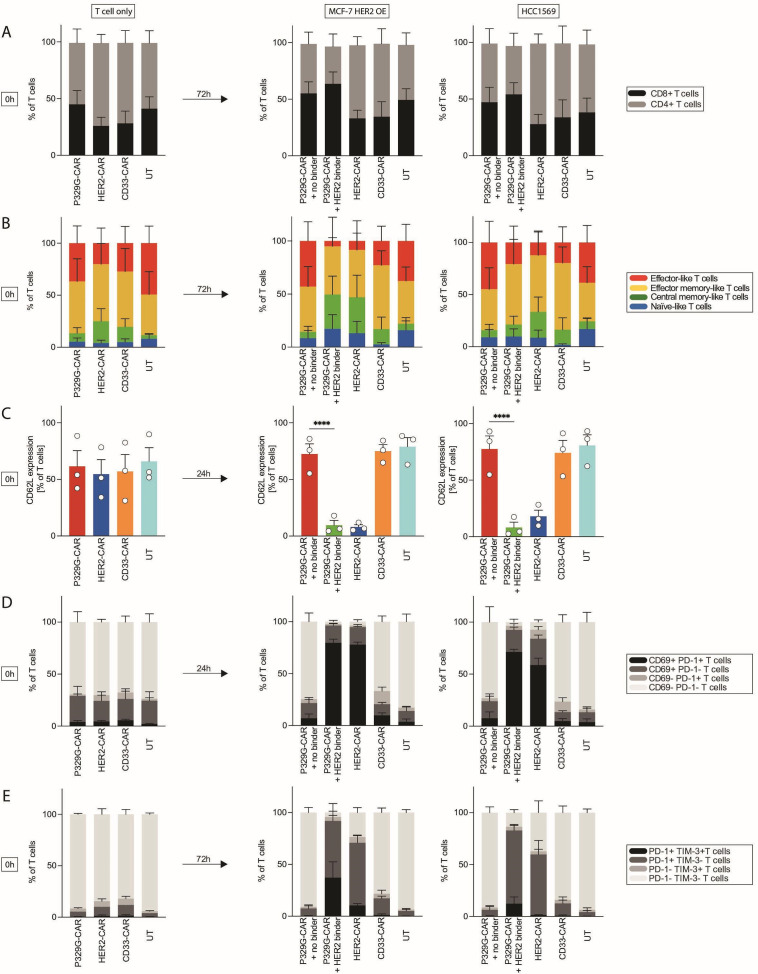
Figure 5.
Phenotypic changes of CAR T cells after activation. Phenotype of P329G-targeting CAR (P329G-CAR), HER2-targeting CAR (HER2-CAR), and CD33-targeting CAR (CD33-CAR) T cells or untransduced T cells (UT) are shown at start of co-culture (0 hours) and after 24 hours or 72 hours of co-culture in the presence of MCF-7 HER2 OE or HCC1569 of three donors (n=3). (A) CD8+ and CD4+ T cells are shown. (B) T cell subpopulations are shown. Naïve-like T (TN) cells were defined as CD45RA+ CCR7+, central memory-like T (TCM) cells as CD45RA- CCR7+, effector memory-like T (TEM) cells as CD45RA- CCR7- and effector-like T (Teff) cells as CD45RA+ CCR7-. Changes in T cell subpopulations were not significant (NS). (C) Expression of CD62L is shown. (D) Expression of CD69 and PD-1 is shown. P329G-CAR T cells in the presence or absence of HER2 binder were compared for MCF-7 HER2 OE and for HCC1569: p<0.0001 for CD69+ PD-1+, NS for CD69+ PD-1-, NS for CD69- PD-1+, p<0.0001 for CD69- PD-1-. (E) Expression of PD-1 and TIM-3 is shown. P329G-CAR T cells in the presence or absence of HER2 binder where compared for MCF-7 HER2 OE: p<0.05 for PD-1+ TIM-3+, p<0.01 for PD-1+ TIM-3-, NS for PD-1- TIM-3+, p<0.0001 for PD-1- TIM-3-; and for HCC1569: NS for PD-1+ TIM-3+, p<0.0001 for PD-1+ TIM-3-, NS for PD-1- TIM-3+, p<0.0001 for PD-1- TIM-3-. Each experiment was performed in triplicates. Values in all graphs represent means±SEM (*p<0.05, **p<0.01, ***p<0.001, ****p<0.0001). Selected p values are shown in the figures or described in the legend.

