

Abstract
Objective
Both low and high body mass index (BMI) have been associated with greater mortality in older adults. This study aimed to evaluate the trajectory of BMI in the final years of life.
Methods
A population-based cohort study was conducted including community-dwelling adults in the English Longitudinal Study of Ageing between 1998 and 2012. BMI was evaluated in relation to age and years before death. Number of long-term conditions, cigarette smoking and socioeconomic position were evaluated as effect modifiers.
Results
Data were analysed for 16 924 participants with 31 857 BMI records; mean age at study starts, 61.6 (SD 10.9) years; mean BMI, 27.5 (4.7) Kg/m2. There were 3686 participants (4794 BMI records) who died and 13 238 participants (27 063 BMI records) who were alive at last follow-up. Mean BMI increased with age to 60–69 years but then declined, but the age-related decline was more rapid in decedents. From 4 to 7 years before death or end of study, adjusted mean BMI was 0.87 (95% CI 0.50 to 1.24) Kg/m2 lower for male decedents than survivors and 1.02 (0.56 to 1.47) lower in women; and from 3 to 0 years before death, BMI was 1.39 (0.98 to 1.80) Kg/m2 lower in male decedents and 2.12 (1.60 to 2.64) lower in female decedents. Multiple long-term conditions and lower socioeconomic position were associated with higher peak BMI and greater BMI decline; current smoking was associated with lower BMI and greater BMI decline.
Conclusions
In community-dwelling older adults, mean BMI enters an accelerating decline from up to 8 years before death. Multiple long-term conditions, smoking and lower socioeconomic position are associated with BMI decline.
Keywords: PUBLIC HEALTH, EPIDEMIOLOGY, GERIATRIC MEDICINE
Strengths and limitations of this study.
This study analysed data for 16 924 participants with 31 857 body mass index (BMI) records from the English Longitudinal Study of Ageing from 1998 to 2012.
Linear mixed models were employed to estimate the difference in BMI between decedents and survivors by time before death or end of study.
Mortality follow-up ended in 2012 and follow-up for survivors was at predefined time intervals.
Non-response bias and sample attrition have potential to bias estimates
Introduction
The recent increase in obesity has accentuated the development of multiple morbidity at middle and older ages,1 focusing attention on the association of body mass index (BMI) with mortality.2 Meta-analyses of cohort studies suggest that there is strong association between BMI and all-cause mortality,3–5 but there is evidence of ‘U’ or ‘J’-shaped relationship with either low or high BMI being associated with greater mortality than normal body weight or overweight.6–9 The association of BMI with mortality may vary with age. In middle-age, obesity is associated with greater mortality but, over the age of 65 years, mortality may be more strongly associated with low BMI and possible sarcopenia.10 ‘Reverse causation’ is believed to account for the association of low BMI with mortality, because illnesses leading to death may be associated with weight loss.11 However, there is only limited direct evidence for reverse causation because only a minority of studies have included longitudinal measurements of body weight.12 Systolic blood pressure and total cholesterol values show similar patterns of association with either low or high blood pressure or total cholesterol being associated with higher mortality.13 14 Longitudinal analysis of blood pressure and cholesterol values recorded into electronic health records found evidence that both blood pressure and total cholesterol values decline towards the end of life.15 16 This supports a possible role of reverse causation in explaining the associations of low blood pressure or low total cholesterol with mortality. We hypothesised that BMI may show a declining trajectory towards the end of life. We aimed to analyse data from a cohort of older adults from the English Longitudinal Study of Ageing (ELSA)17 in order to evaluate changes in BMI values in the period before death. We also investigated whether there was evidence that BMI trajectories varied for groups of participants defined by level of morbidity, smoking and socioeconomic position.
Methods
Study design and participants
A retrospective cohort study was conducted using the ELSA.18 The initial ELSA cohort included community-dwelling adults aged 50 and over, and their younger partners, drawn from households that responded to the Health Survey for England in 1998, 1999 and 2001 (wave 0). Participants were 16 924 participants aged 40–90 years with data for BMI at wave 0. Participants aged less than 40 years were excluded, as were participants aged more than 90 years because their exact ages were not available for analysis. A flowchart for participant and data selection is shown in online supplemental figure 1. Separate data files for each year of data collection at wave 0, and for each subsequent wave, were linked using the unique participant identifier that was employed to track individual participants across waves. Covariate data were drawn from wave 0 files as outlined below.
bmjopen-2022-062893supp001.pdf (46.4KB, pdf)
Measures
Measurements of height and weight were recorded by nurse fieldworkers at waves 0, 2, 4 and 6. Standing height was measured using a portable stadiometre without shoes. One measurement was taken with participants stretching with the head in the Frankfort plane. Weight was measured in light clothing using portable electronic scales.19 One BMI value of <10 Kg/m2 was omitted. Mortality was all-cause mortality up to February 2012, the latest date when the ELSA study mortality data were updated from the National Health Service Central Data Registry records.20 Covariates included age at measurement and the number of years before death. For decedents, years till death were calculated as the difference between the year of death recorded in the ELSA data set and the year of measurement. For survivors, years till end of study were calculated as 2012 (the last year of mortality follow-up) minus the year of measurement. Because follow-up was conducted in waves, only selected values of years till end of study were possible for survivors. Covariate data from wave 0 included gender, ethnicity (‘white’, ‘non-white’) highest educational qualifications (categories: not applicable; degree or equivalent; higher education below degree; a level or equivalent; General Certificate of Education Ordinary (GCE O) level or equivalent; other; foreign qualification; no qualification), housing tenure (categories: owner; buying with mortgage including part rent and part mortgage; rented; live rent free; other and not applicable) and social class (categories: professional and managerial or technical; skilled non-manual; skilled manual, semiskilled and unskilled manual; armed forces, other and not applicable). We also included cigarette smoking (never smoked, former occasional smoker and former regular smoker, current smoker), alcohol consumption in units per week (<7, 7 to <14, 14 to <21, ≥21 and not known), and number of long-term conditions up to four or more. Eligible long-term conditions included neoplasms, infections and disorders affecting the endocrine, mental health, nervous, eye, ear, cardiac, respiratory, digestive, genitourinary, skin, musculoskeletal and haematological systems.
Statistical analysis
Recorded BMI values represented the units for analysis. Linear mixed models were employed to model repeated BMI values over time, with a random intercept at the participant-level using the ‘xtreg’ command in Stata V.14.21 A test for interaction revealed strong evidence that the association of BMI with either age and or years till death differed by mortality status. Models were, therefore, fitted separately for participants who died (decedents) and those who were alive at the end of follow-up (survivors). Data for men and women were also considered separately.22 In order to provide a consistent modelling approach, age and years till death were fitted as continuous variables, together with quadratic terms to allow for non-linearity. The mean difference in BMI between survivors and decedents was estimated for the periods 0 to 3, 4 to 7 and 8 or more years before death by fitting linear mixed models with time before death in categories and including participant as a random intercept. These estimates were adjusted for age, age-squared, cigarette smoking, alcohol consumption, number of long-term conditions, social class, housing tenure and education. In order to visualise the data, with more flexible curve fitting, fractional polynomials for age were employed using the ‘fpfitci’ command in Stata V.14. Curves were estimated separately for subgroups of long-term conditions, cigarette smoking and socioeconomic position including housing tenure and social class.
Patient and public involvement
Patients or the public were not involved in the design, or conduct, or reporting, or dissemination plans of our research.
Results
The cohort included 16 924 participants with 31 857 BMI records. There were 3686 participants, with 4794 BMI records, who died; and 13 238 participants, with 27 063 BMI records who did not die at end of follow-up (table 1). Compared with survivors, decedents were older and included more men, current or former smokers, had more long-term conditions and generally had lower socioeconomic position based on social class, housing tenure and educational qualifications (table 1).
Table 1.
Characteristics of survivors and decedents at baseline (wave 0)
| Variable | Category | Survivors (13 238) |
Decedents (3686) |
| Gender | Female | 7625 (58) | 1783 (48) |
| Ethnicity | Non-white | 497 (4) | 54 (1) |
| Age (years) | Mean, SD | 59 (10) | 71 (10) |
| Smoking | Never | 5208 (39) | 1013 (27) |
| Former | 5386 (41) | 1798 (49) | |
| Current | 2644 (20) | 875 (24) | |
| Alcohol (units per week) |
<7 | 6185 (47) | 1706 (46) |
| 7 to 13 | 2260 (17) | 558 (15) | |
| 14 to 20 | 1299 (10) | 265 (7) | |
| ≥21 | 2182 (16) | 525 (14) | |
| Not recorded | 1312 (10) | 632 (17) | |
| LTC count | None | 6234 (47) | 1061 (29) |
| 1 | 4169 (31) | 1258 (34) | |
| 2 | 1941 (15) | 832 (23) | |
| 3 | 660 (5) | 372 (10) | |
| ≥4 | 234 (2) | 163 (4) | |
| Social class | Professional | 802 (6) | 156 (4) |
| Managerial | 3983 (30) | 841 (23) | |
| Skilled non-manual | 2171 (16) | 658 (18) | |
| Skilled manual | 3297 (25) | 1048 (28) | |
| Semiskilled manual | 1959 (15) | 637 (17) | |
| Unskilled manual | 774 (6) | 249 (7) | |
| Not classified | 252 (2) | 97 (3) | |
| Housing tenure | Owner-occupier | 6178 (47) | 1998 (54) |
| Mortgage holder | 4723 (36) | 492 (13) | |
| Rented | 2226 (17) | 1146 (31) | |
| Living rent free | 111 (1) | 50 (1) | |
| Education | Degree | 1496 (11) | 210 (6) |
| College below degree | 1461 (11) | 233 (6) | |
| A level or equivalent | 884 (7) | 138 (4) | |
| O level or equivalent | 2350 (18) | 333 (9) | |
| CSE or other | 582 (4) | 218 (6) | |
| Foreign qualifications | 1019 (8) | 284 (8) | |
| No qualification | 5446 (41) | 2270 (62) |
Figures are frequencies (per cent of column total).
CSE, Certificate of Secondary Education; LTC, long-term condition.
Table 2 shows the distribution of mean BMI by gender, age-group and years till death or end of study. Mean BMI was generally similar for men and women, but the SD for BMI was greater in women consistent with the greater prevalence of severe obesity in women. In survivors, mean BMI increased from 27.1 Kg/m2 at age 40–44 years to 28.1 Kg/m2 between 55 and 74 years, before declining to 26.6 Kg/m2 at age 85 to 90 years. A similar pattern was observed in decedents, but the highest BMI was observed between 45 and 64 years and the mean BMI in the oldest age-group was lower at 25.6 Kg/m2. In survivors, mean BMI tended to increase over time from 27.4 Kg/m2 at 14 years before the end-of-study to 28.2 Kg/m2 at the end-of-study. In decedents, mean values were less stable because of the smaller number of observations. However, mean BMI declined in the last 5 years of life from 27.5 Kg/m2 5 years before death to 26.0 Kg/m2 in the last year of life.
Table 2.
Body mass index (BMI) by gender, age-group and years till death or end of study
| Survivors | Decedents | ||||
| Frequency | Mean BMI (SD) | Frequency | Mean BMI (SD) | ||
| Gender | Men | 11 657 | 27.8 (4.1) | 2496 | 27.2 (4.5) |
| Women | 15 406 | 27.9 (5.3) | 2298 | 27.0 (5.3) | |
| Age at measurement (years) | 40–44 | 411 | 27.1 (5.8) | 7 | 27.1 (4.5) |
| 45–54 | 5294 | 27.5 (4.8) | 283 | 28.1 (6.3) | |
| 55–64 | 9436 | 28.1 (5.0) | 732 | 28.1 (5.4) | |
| 65–74 | 7724 | 28.1 (4.7) | 1534 | 27.5 (5.0) | |
| 75–84 | 3677 | 27.7 (4.5) | 1801 | 26.6 (4.5) | |
| 85–90 | 521 | 26.6 (4.4) | 437 | 25.6 (3.9) | |
| Years till death or end of study | 0 | 3228 | 28.2 (5.1) | 150 | 26.0 (4.9) |
| −1 | – | 385 | 26.4 (5.0) | ||
| −2 | – | 443 | 26.7 (4.6) | ||
| −3 | 2483 | 28.3 (5.3) | 448 | 27.0 (5.2)− | |
| −4 | 2314 | 28.3 (5.0) | 416 | 26.8 (4.9) | |
| −5 | – | 425 | 27.5 (4.9) | ||
| −6 | – | 471 | 27.4 (5.2) | ||
| −7 | 3212 | 28.0 (4.8) | 421 | 26.9 (5.0) | |
| −8 | 2588 | 27.9 (4.8) | 350 | 27.5 (4.9) | |
| −9 | – | 318 | 27.2 (4.7) | ||
| −10 | – | 333 | 27.2 (4.6) | ||
| −11 | 5261 | 27.8 (4.7) | 242 | 27.7 (4.7) | |
| −12 | 191 | 28.1 (5.5) | |||
| −13 | 2621 | 27.4 (4.6) | 165 | 27.5 (4.7) | |
| −14 | 5356 | 27.4 (4.5) | 36 | 28.0 (4.4) | |
Figures are mean (SD) BMI.
Figure 1 (left panel) shows mean BMI values (points) and predicted BMI values (lines) by single year of age for survivors (blue) and decedents (red). BMI increased up to approximately age 65 years. Over the age of 70 years, mean BMI declined with each increasing year of age, with the decline being more rapid in decedents than survivors. In survivors, points were generally close to predicted values; in decedents, while points were close to predicted values at older ages, at young ages where there were fewer deaths, there were outlying values of either high or low BMI values.
Figure 1.
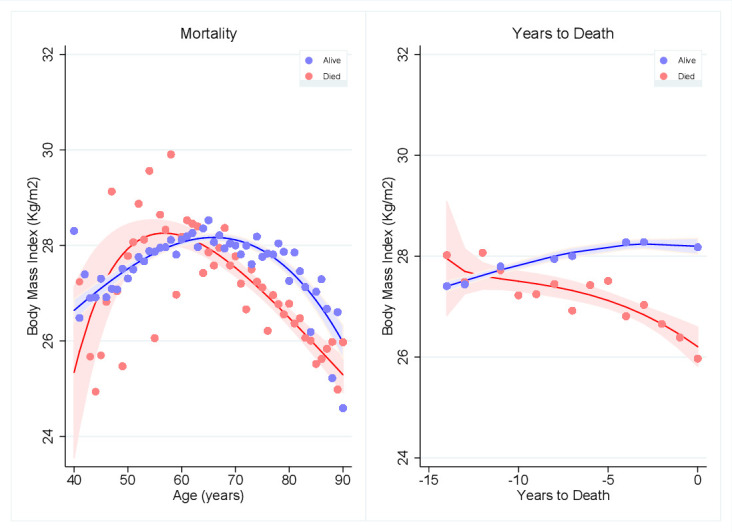
Mean BMI by age (left panel) and mean BMI by years before death or end of study (right panel) for decedents (red) and survivors (blue). Points are mean BMI values, lines are fractional polynomial prediction plots. Error bands are 95% CIs. BMI, body mass index.
Figure 1 (right panel) shows mean BMI values (95% CIs) by year before death for decedents or end-of-study for survivors, together with predicted values from a fractional polynomial model. While BMI remained stable or increased in survivors, there was evidence of declining BMI towards the end of life in decedents.
Table 3 provides coefficients from linear mixed models. Age was associated with positive coefficients in both decedents and survivors. By contrast, years to death was associated with a positive coefficient in survivors, indicating a generally increasing trend over time up to the end of study; but the equivalent coefficient was negative in decedents, indicating a decreasing trend in BMI towards death. Quadratic terms for age and years to death were associated with negative coefficients consistent with a downward curvature rather than a straight line. As expected, intraparticipant correlation coefficients were high.
Table 3.
Regression models for BMI
| Variable | Survivors | Decedents | ||
| Male | Female | Male | Female | |
| Age | 0.245 (0.027) | 0.375 (0.024) | 0.239 (0.090) | 0.567 (0.109) |
| Age2 | −0.002 (0.000) | −0.003 (0.000) | −0.002 (0.001) | −0.004 (0.001) |
| Years to death | 0.055 (0.014) | 0.048 (0.015) | −0.075 (0.052) | −0.300 (0.065) |
| Years to death squared | −0.002 (0.001) | −0.002 (0.001) | −0.007 (0.004) | −0.022 (0.005) |
| Constant | 21.743 (0.918) | 17.041 (0.868) | 21.576 (3.113) | 9.121 (3.806) |
| Sigma_u | 3.712 | 4.902 | 4.160 | 4.982 |
| Sigma_e | 1.506 | 1.771 | 1.722 | 1.877 |
| Rho | 0.859 | 0.886 | 0.854 | 0.876 |
Sigma_u, participant-level SD; Sigma_e, observation-level SD; Rho, intra-participant correlation coefficient
Figures are coefficients (SE) except where indicated
BMI, body mass index.
Table 4 shows mean differences in BMI between decedents and survivors for 4 year periods before death. Estimates were adjusted for age, smoking, alcohol, long-term conditions and socioeconomic status. At 8 or more years before death, there was no evidence that BMI differed between decedents and survivors. However, at 4 to 7 years before death, mean BMI was 0.87 (95% CI 0.50 to 1.24) Kg/m2 lower in male decedents than survivors and 1.02 (0.56 to 1.47) Kg/m2 lower in female decedents than survivors. In the 4 years leading up to death, mean BMI was 1.39 (95% CI 0.98 to 1.80) Kg/m2 lower in male decedents than survivors and 2.12 (1.60 to 2.64) Kg/m2 lower in female decedents than survivors.
Table 4.
Mean difference (95% CI) in BMI between decedents and survivors by time before death
| Years before death | Difference in BMI (Kg/m2) between decedents and survivors | |||
| Men | Women | |||
| Adjusted mean difference* (95% CI) | P value | Adjusted mean difference* (95% CI) | P value | |
| 0–3 years | −1.39 (−1.80 to −0.98) | <0.001 | −2.12 (−2.64 to −1.60) | <0.001 |
| 4–7 years | −0.87 (−1.24 to −0.50) | <0.001 | −1.02 (−1.47 to −0.56) | <0.001 |
| 8 or more years | −0.07 (−0.37 to 0.24) | 0.664 | −0.38 (−0.76 to 0.00) | 0.050 |
*Estimates were adjusted for age, age2, education, housing tenure, social class, cigarette smoking, alcohol consumption and number of long-term conditions.
BMI, body mass index.
We investigated whether BMI trajectories varied for groups of participants defined by covariates that were expected to be associated with mortality. Figure 2 shows BMI trajectories by number of long-term conditions and smoking status at wave 0. BMI values were greater for participants with more long-term conditions (figure 2, left panel), especially at younger ages, but there was convergence of trajectories at older ages, consistent with greater age-related decline for participants with long-term conditions at baseline. Compared with non-smokers, current smokers had lower BMI and ex-smokers had higher BMI values at all ages (figure 2, right panel), but the appearances were suggestive of more accelerated BMI decline in smokers. Lower socioeconomic position in terms of rental housing tenure (figure 3, left panel) or manual occupational social class (figure 3, right panel) was also associated with higher BMI values in middle age but more accelerated BMI decline at older ages. Alcohol consumption and BMI trajectory are shown for completeness in online supplemental figure 2, with no consistent pattern of association.
Figure 2.
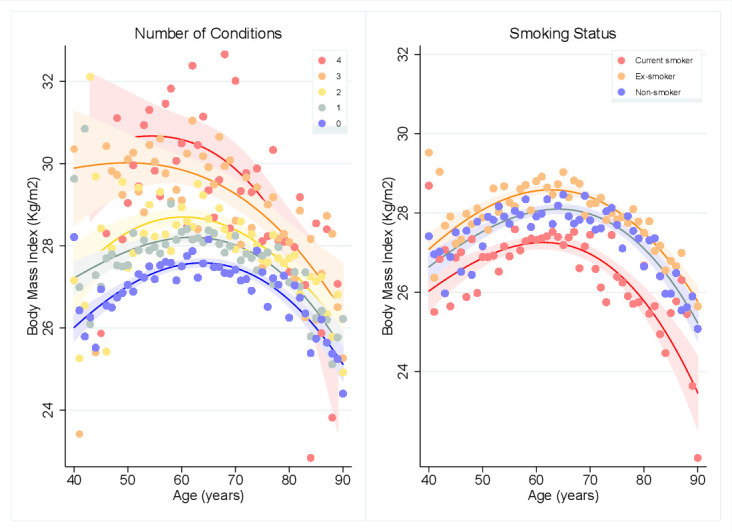
Mean BMI by age and number of long-term conditions (left panel) and mean BMI by age and smoking status (right panel). Points are mean BMI values, lines are fractional polynomial prediction plots. Error bands are 95% CIs. BMI, body mass index.
Figure 3.
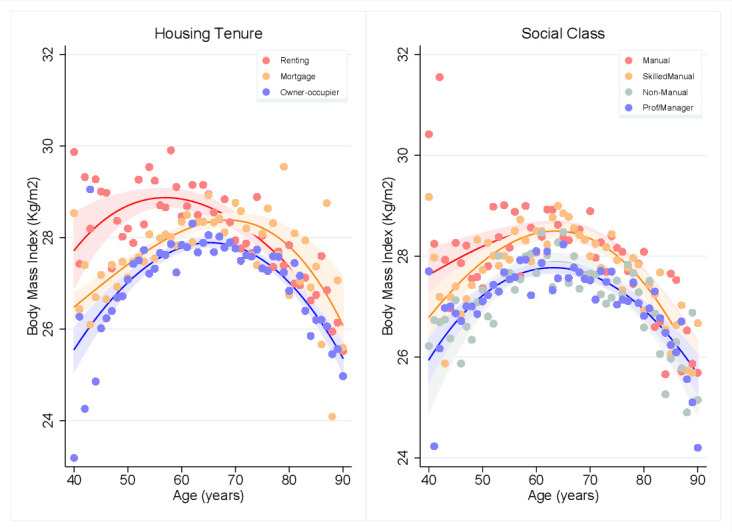
Mean BMI by age and housing tenure (left panel) and mean BMI by age and social class (right panel). Points are mean BMI values, lines are fractional polynomial prediction plots. Error bands are 95% CIs. BMI, body mass index.
bmjopen-2022-062893supp002.pdf (162.1KB, pdf)
Discussion
Main findings
BMI enters a decline over the age of 65–70 years, and this decline is earlier and more rapid in decedents than survivors. After adjusting for age and covariates, BMI for decedents was found to show an increasing difference from survivors in the last 8 years of life. Diehr et al23 observed that the processes of ageing and dying may be difficult to distinguish. While BMI decline may a feature of ageing, accelerated loss of body mass may result from pathological processes leading to mortality. In this study, decedents showed a substantially greater age-related decline in BMI than survivors and the gradient relating BMI to years to death or end of study were of opposite sign for decedents and survivors. We found evidence that variables associated with mortality including multiple long-term conditions, cigarette smoking and lower socioeconomic position were associated with distinct BMI trajectories that could contribute to accelerated BMI decline in decedents. Consequently, associations of lower BMI with mortality9 are likely to be explained by ‘reverse’ causation, where mortality risk is the predictor of BMI.
Strengths and limitations
The present analyses drew on data for a well-established, population-based cohort study with well-described measurement techniques.17 However, in common with most cohort studies, non-response bias and attrition might contribute to bias. The response rate in ELSA was approximately 67% at wave 0 and there was attrition at subsequent waves.17 The sample might be less representative over time, but this bias might have the effect of diminishing estimated associations if people who were ill were less likely to participate in the study. Mortality follow-up was restricted to the period up to 2012, which was the latest date to which data were linked by the UK Office for National Statistics. Survivors might be misclassified if they died soon after the end of follow-up as in most cohort studies. Follow-up waves of data collection were conducted periodically, and BMI records were limited to those participants who participated in measurements during years in which follow-up waves of data collection were conducted.
Comparison with other studies
The association of BMI with mortality is controversial. In a highly cited meta-analysis of cohort studies, the Global BMI mortality collaboration found that mortality was lowest at a BMI of 20–25 Kg/m2. Flegal et al24 pointed out that this conclusion was only possible if data for smokers, people with pre-existing conditions and people who died in the first 5 years of follow-up were excluded. These exclusions accounted for 60% of data and over 75% of fatal events. BMI has been increasing globally and many populations now have mean BMI values that exceed 25 Kg/m225 with many studies finding that BMI values in the ‘overweight’ category may be associated with low mortality.26 In the WHO classification of obesity, the mean BMI value for the present ELSA cohort was consistent with ‘overweight’ rather than ‘healthy’ body weight. However, the present results show that BMI trajectories compiled from longitudinal measurements may be more informative than cross-sectional assessment of BMI values in the analysis of associations of BMI and mortality. The importance of variations in body fat distribution and body composition at a given level of BMI is also increasingly recognised. While low body fat mass may be associated with lower mortality, lower lean body mass may be associated with higher mortality than intermediate values,27 and sarcopenia is associated with greater mortality at older ages.28
Conclusions
From a life-course perspective, BMI does not have a unique association with mortality, rather BMI trajectories vary in groups of participants defined by predictors of mortality. There is a more accelerated age-related decline in groups with higher mortality and BMI is found to decline at the end of life. Routine monitoring of BMI trajectories may be informative in clinical settings. From a public health perspective, promoting healthy ageing may require avoidance of excess body weight at younger ages, but preservation of body mass at older ages.
Supplementary Material
Footnotes
Contributors: This work was conducted as part of a medical student elective at King’s College London, GKT School of Medicine. Both authors developed the idea for the study. HP conducted data analyses, which MCG replicated and extended. HP drafted the paper and MCG edited the draft. Both authors approved the final draft. MCG is guarantor.
Funding: The authors have not declared a specific grant for this research from any funding agency in the public, commercial or not-for-profit sectors.
Competing interests: None declared.
Provenance and peer review: Not commissioned; externally peer reviewed.
Supplemental material: This content has been supplied by the author(s). It has not been vetted by BMJ Publishing Group Limited (BMJ) and may not have been peer-reviewed. Any opinions or recommendations discussed are solely those of the author(s) and are not endorsed by BMJ. BMJ disclaims all liability and responsibility arising from any reliance placed on the content. Where the content includes any translated material, BMJ does not warrant the accuracy and reliability of the translations (including but not limited to local regulations, clinical guidelines, terminology, drug names and drug dosages), and is not responsible for any error and/or omissions arising from translation and adaptation or otherwise.
Data availability statement
Data are available in a public, open access repository. Data are available in a public, open access repository.[18]
Ethics statements
Patient consent for publication
Not applicable.
Ethics approval
This study involves human participants and was approved by London Multicentre Research Ethics Committee. Number not available. Participants gave informed consent to participate in the study before taking part.
References
- 1.Booth HP, Prevost AT, Gulliford MC. Impact of body mass index on prevalence of multimorbidity in primary care: cohort study. Fam Pract 2014;31:38–43. 10.1093/fampra/cmt061 [DOI] [PMC free article] [PubMed] [Google Scholar]
- 2.Di Angelantonio E, Bhupathiraju S, Wormser D. Body-Mass index and all-cause mortality: individual-participant-data meta-analysis of 239 prospective studies in four continents. Lancet 2016;388:776–86. 10.1016/S0140-6736(16)30175-1 [DOI] [PMC free article] [PubMed] [Google Scholar]
- 3.Aune D, Sen A, Prasad M, et al. Bmi and all cause mortality: systematic review and non-linear dose-response meta-analysis of 230 cohort studies with 3.74 million deaths among 30.3 million participants. BMJ 2016;353:i2156. 10.1136/bmj.i2156 [DOI] [PMC free article] [PubMed] [Google Scholar]
- 4.Berrington de Gonzalez A, Hartge P, Cerhan JR, et al. Body-Mass index and mortality among 1.46 million white adults. N Engl J Med 2010;363:2211–9. 10.1056/NEJMoa1000367 [DOI] [PMC free article] [PubMed] [Google Scholar]
- 5.Prospective Studies Collaboration, Whitlock G, Lewington S, et al. Body-Mass index and cause-specific mortality in 900 000 adults: collaborative analyses of 57 prospective studies. Lancet 2009;373:1083–96. 10.1016/S0140-6736(09)60318-4 [DOI] [PMC free article] [PubMed] [Google Scholar]
- 6.Ng TP, Jin A, Chow KY, et al. Age-Dependent relationships between body mass index and mortality: Singapore longitudinal ageing study. PLoS One 2017;12:e0180818. 10.1371/journal.pone.0180818 [DOI] [PMC free article] [PubMed] [Google Scholar]
- 7.Yuan JM, Ross RK, Gao YT, et al. Body weight and mortality: a prospective evaluation in a cohort of middle-aged men in Shanghai, China. Int J Epidemiol 1998;27:824–32. 10.1093/ije/27.5.824 [DOI] [PubMed] [Google Scholar]
- 8.Jee SH, Sull JW, Park J, et al. Body-Mass index and mortality in Korean men and women. N Engl J Med 2006;355:779–87. 10.1056/NEJMoa054017 [DOI] [PubMed] [Google Scholar]
- 9.Bhaskaran K, Dos-Santos-Silva I, Leon DA, et al. Association of BMI with overall and cause-specific mortality: a population-based cohort study of 3·6 million adults in the UK. Lancet Diabetes Endocrinol 2018;6:944–53. 10.1016/S2213-8587(18)30288-2 [DOI] [PMC free article] [PubMed] [Google Scholar]
- 10.Winter JE, MacInnis RJ, Wattanapenpaiboon N, et al. Bmi and all-cause mortality in older adults: a meta-analysis. Am J Clin Nutr 2014;99:875–90. 10.3945/ajcn.113.068122 [DOI] [PubMed] [Google Scholar]
- 11.Flanders WD, Augestad LB. Adjusting for reverse causality in the relationship between obesity and mortality. Int J Obes 2008;32 Suppl 3:S42–6. 10.1038/ijo.2008.84 [DOI] [PubMed] [Google Scholar]
- 12.Flegal KM, Graubard BI, Williamson DF, et al. Reverse causation and illness-related weight loss in observational studies of body weight and mortality. Am J Epidemiol 2011;173:1–9. 10.1093/aje/kwq341 [DOI] [PubMed] [Google Scholar]
- 13.Guo Z, Viitanen M, Winblad B. Low blood pressure and five-year mortality in a Stockholm cohort of the very old: possible confounding by cognitive impairment and other factors. Am J Public Health 1997;87:623–8. 10.2105/AJPH.87.4.623 [DOI] [PMC free article] [PubMed] [Google Scholar]
- 14.Petersen LK, Christensen K, Kragstrup J. Lipid-Lowering treatment to the end? A review of observational studies and RCTs on cholesterol and mortality in 80+-year olds. Age Ageing 2010;39:674–80. 10.1093/ageing/afq129 [DOI] [PMC free article] [PubMed] [Google Scholar]
- 15.Ravindrarajah R, Hazra NC, Hamada S, et al. Systolic Blood Pressure Trajectory, Frailty, and All-Cause Mortality >80 Years of Age: Cohort Study Using Electronic Health Records. Circulation 2017;135:2357–68. 10.1161/CIRCULATIONAHA.116.026687 [DOI] [PMC free article] [PubMed] [Google Scholar]
- 16.Charlton J, Ravindrarajah R, Hamada S, et al. Trajectory of total cholesterol in the last years of life over age 80 years: cohort study of 99,758 participants. J Gerontol A Biol Sci Med Sci 2018;73:1083–9. 10.1093/gerona/glx184 [DOI] [PubMed] [Google Scholar]
- 17.Steptoe A, Breeze E, Banks J, et al. Cohort profile: the English longitudinal study of ageing. Int J Epidemiol 2013;42:1640–8. 10.1093/ije/dys168 [DOI] [PMC free article] [PubMed] [Google Scholar]
- 18.Oldfield Z, Rogers N, Phelps A, et al. English Longitudinal Study of Ageing: Waves 0-9, 1998-2019. [data collection]. 33rd Edition. UK Data Service. SN: 5050, 2020. Available: 10.5255/UKDA-SN-5050-20 [DOI]
- 19.Zaninotto P, Lassale C. Socioeconomic trajectories of body mass index and waist circumference: results from the English longitudinal study of ageing. BMJ Open 2019;9:e025309. 10.1136/bmjopen-2018-025309 [DOI] [PMC free article] [PubMed] [Google Scholar]
- 20.Dregan A, Ravindrarajah R, Hazra N, et al. Longitudinal trends in hypertension management and mortality among octogenarians: prospective cohort study. Hypertension 2016;68:97–105. 10.1161/HYPERTENSIONAHA.116.07246 [DOI] [PMC free article] [PubMed] [Google Scholar]
- 21.Corp S. Stata statistical software: release 14. College Station, TX: StataCorp LP, 2015. [Google Scholar]
- 22.Sobal J, Stunkard AJ. Socioeconomic status and obesity: a review of the literature. Psychol Bull 1989;105:260–75. 10.1037/0033-2909.105.2.260 [DOI] [PubMed] [Google Scholar]
- 23.Diehr P, Williamson J, Burke GL, et al. The aging and dying processes and the health of older adults. J Clin Epidemiol 2002;55:269–78. 10.1016/S0895-4356(01)00462-0 [DOI] [PubMed] [Google Scholar]
- 24.Flegal KM, Ioannidis JPA, Doehner W. Flawed methods and inappropriate conclusions for health policy on overweight and obesity: the global BMI mortality collaboration meta-analysis. J Cachexia Sarcopenia Muscle 2019;10:9–13. 10.1002/jcsm.12378 [DOI] [PMC free article] [PubMed] [Google Scholar]
- 25.Finucane MM, Stevens GA, Cowan MJ, et al. National, regional, and global trends in body-mass index since 1980: systematic analysis of health examination surveys and epidemiological studies with 960 country-years and 9·1 million participants. Lancet 2011;377:557–67. 10.1016/S0140-6736(10)62037-5 [DOI] [PMC free article] [PubMed] [Google Scholar]
- 26.Flegal KM, Kit BK, Orpana H, et al. Association of all-cause mortality with overweight and obesity using standard body mass index categories: a systematic review and meta-analysis. JAMA 2013;309:71–82. 10.1001/jama.2012.113905 [DOI] [PMC free article] [PubMed] [Google Scholar]
- 27.Lee DH, Keum N, Hu FB, et al. Predicted lean body mass, fat mass, and all cause and cause specific mortality in men: prospective US cohort study. BMJ 2018;362:k2575. 10.1136/bmj.k2575 [DOI] [PMC free article] [PubMed] [Google Scholar]
- 28.Bachettini NP, Bielemann RM, Barbosa-Silva TG, et al. Sarcopenia as a mortality predictor in community-dwelling older adults: a comparison of the diagnostic criteria of the European Working group on sarcopenia in older people. Eur J Clin Nutr 2020;74:573–80. 10.1038/s41430-019-0508-8 [DOI] [PubMed] [Google Scholar]
Associated Data
This section collects any data citations, data availability statements, or supplementary materials included in this article.
Supplementary Materials
bmjopen-2022-062893supp001.pdf (46.4KB, pdf)
bmjopen-2022-062893supp002.pdf (162.1KB, pdf)
Data Availability Statement
Data are available in a public, open access repository. Data are available in a public, open access repository.[18]