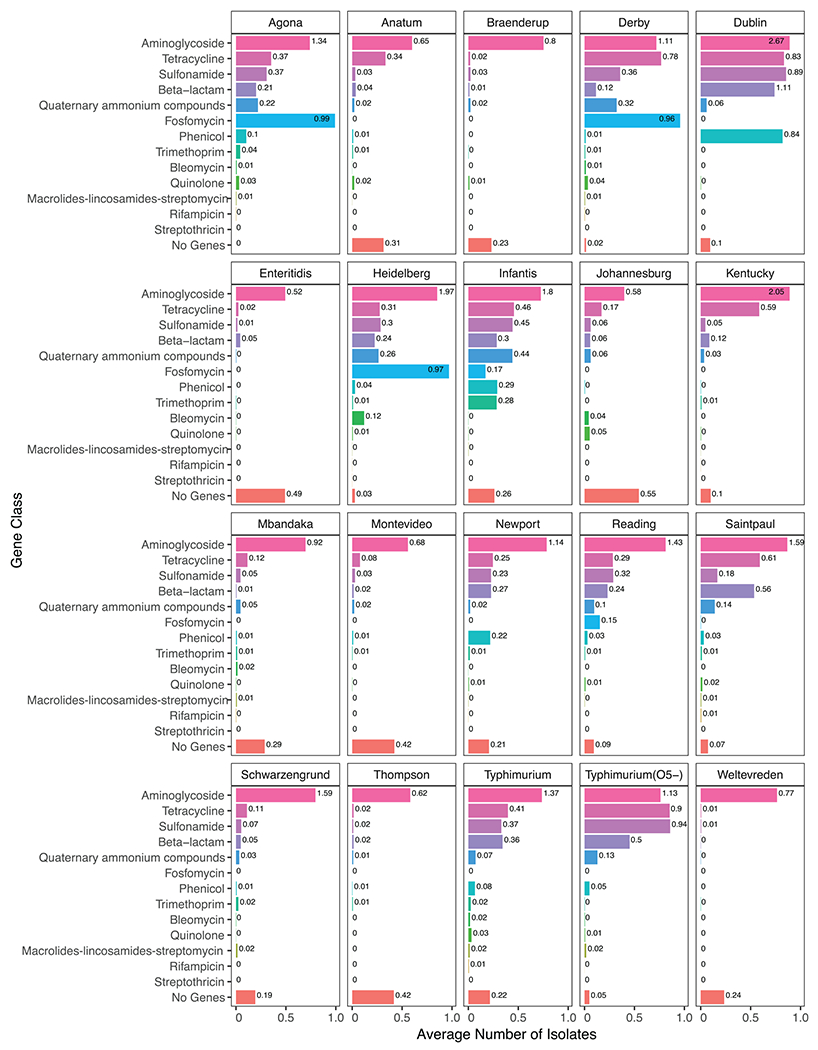
FIGURE 2.

The proportion of isolates within each serovar whose genome included a given type of AMR gene or no AMR genes. Numbers at the ends of the bars represent the average number of AMR gene classes observed within isolates of that serovar (e.g., for Salmonella Agona, many isolates had multiple aminoglycoside AMR genes for an average of 1.34 aminoglycoside genes per isolate).
