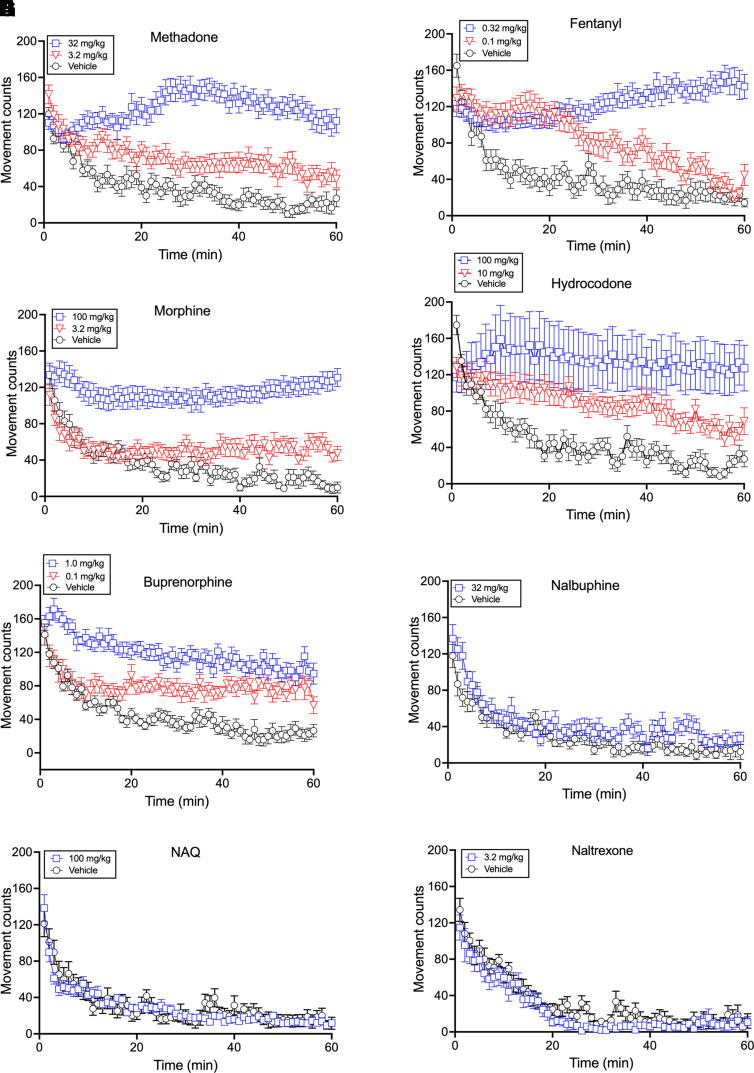
Fig. 3.
Time course of locomotor activating effects produced by opioids with differing MOR efficacy. Each panel shows time course data over a 60-minute session for a different drug. For most drugs, data are shown for vehicle, the lowest dose to significantly increase locomotion, and the Emax dose producing the highest level of locomotor activation. Nalbuphine, NAQ, and naltrexone show only data for vehicle and the highest dose tested. Abscissae: Time in min for the 60-minute session. Ordinates: movement counts over the 60-minute session. Each point shows mean±S.E.M. from 12 mice except the high dose for hydrocodone, which shows N = 6.

