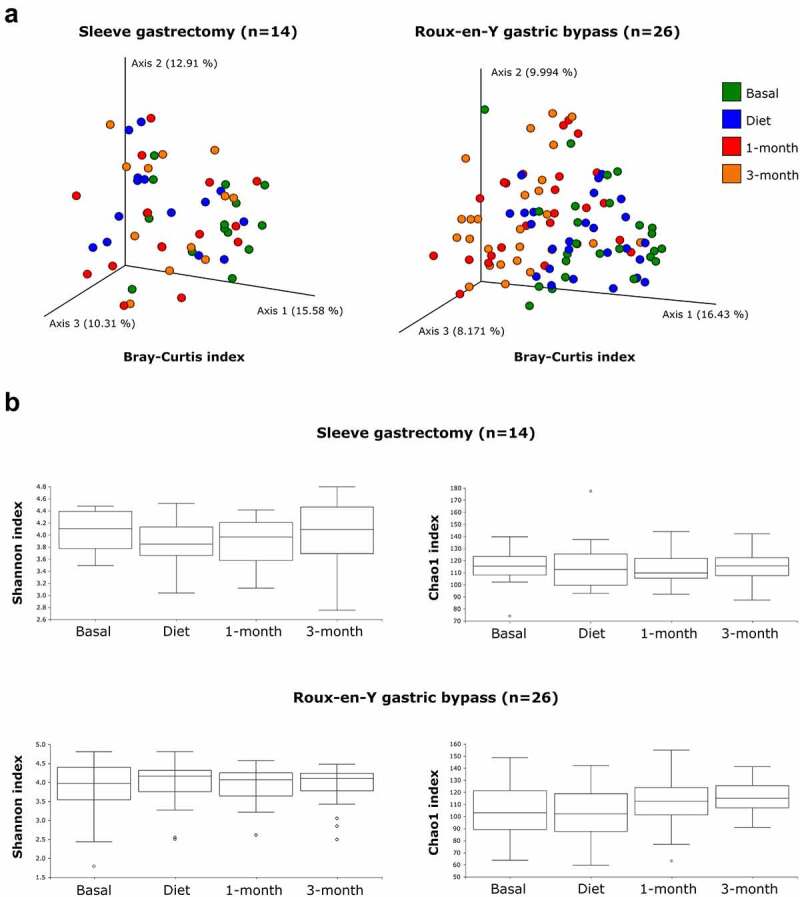
Figure 2.

Bacterial diversity analysis in the two groups of patients throughout the 4 fecal samples. A: PCoA based on beta diversity values of all amplicon sequencing variants (Bray Curtis index), calculated from the bacterial profiles of stool samples. Each point represents a sample, and the color refers to sampling time. B: Alpha diversity values (Shannon and Chao1 indices).
