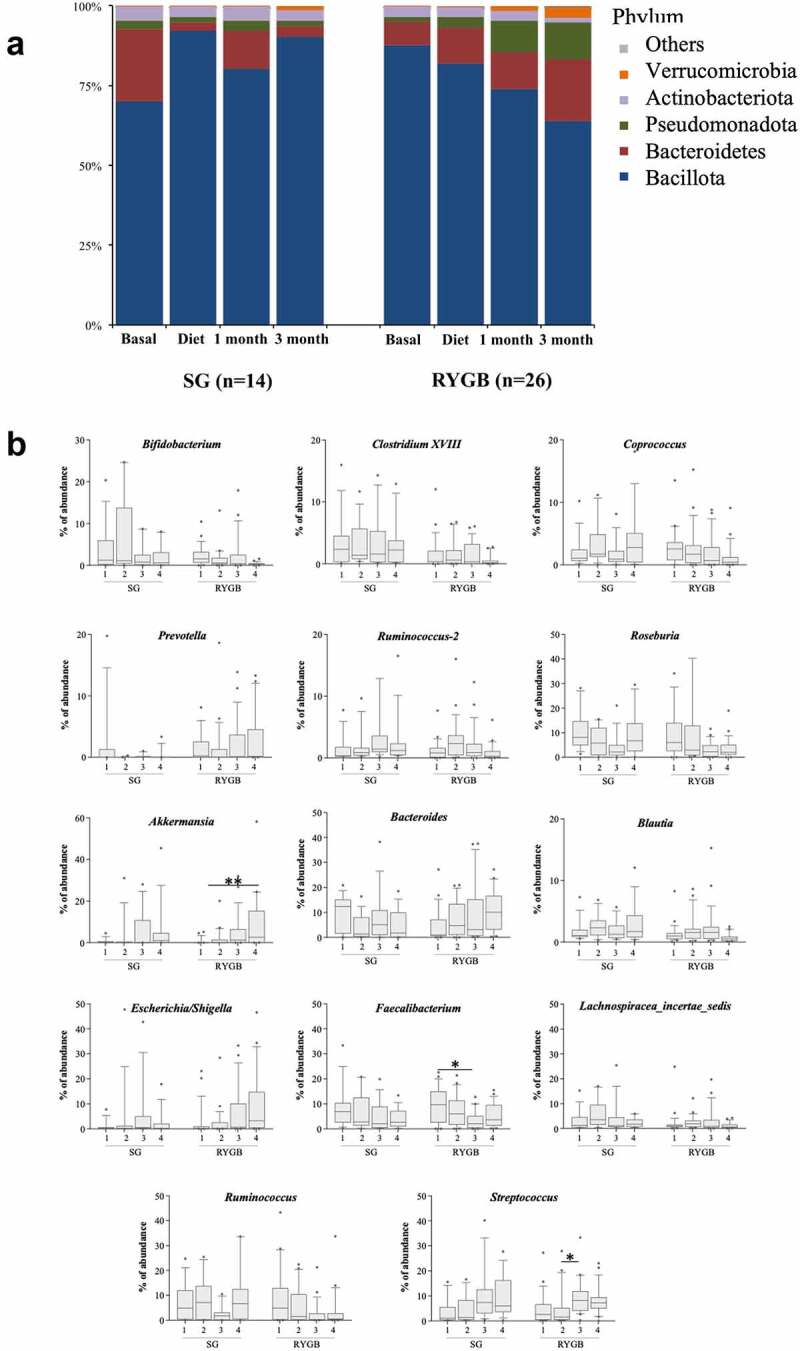
Figure 3.

Bacterial distribution in feces. A: At phylum level. B: at genus level, showing only the most abundant (80% of the total abundance). Samples are represented as 1 = basal, 2 = diet, 3 = 1 month of surgery and 4 = 3 months of surgery. Statistically significant differences between samples are marked as *p < .05, and **p > .01.
