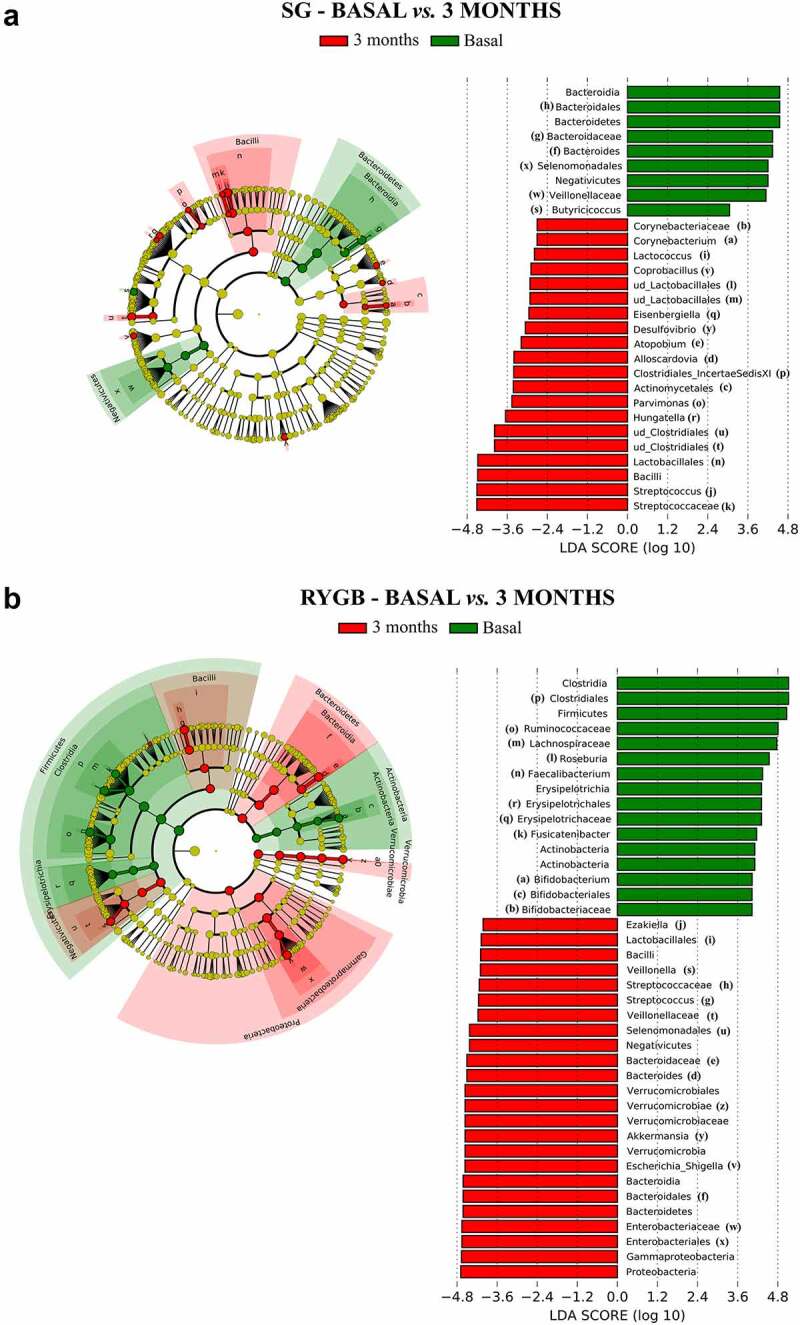
Figure 4.

Bacterial taxa with differential abundance according to linear effect size discriminant analysis (LEfSe). The left side of each graph shows a cladogram, in which the yellow circles represent bacterial taxa that show no significant differences between the groups analyzed, while the green and red circles represent taxa whose abundance is significantly differential between the groups analyzed. The other side of each graph shows the significant taxa ordered according to the magnitude of the differences (LDA score). A: Comparison between baseline and 3 months after surgery in SG. B: Comparison between baseline and 3 months after surgery in RYGB (only taxa with LDA>4 are shown, to simplify the figure).
