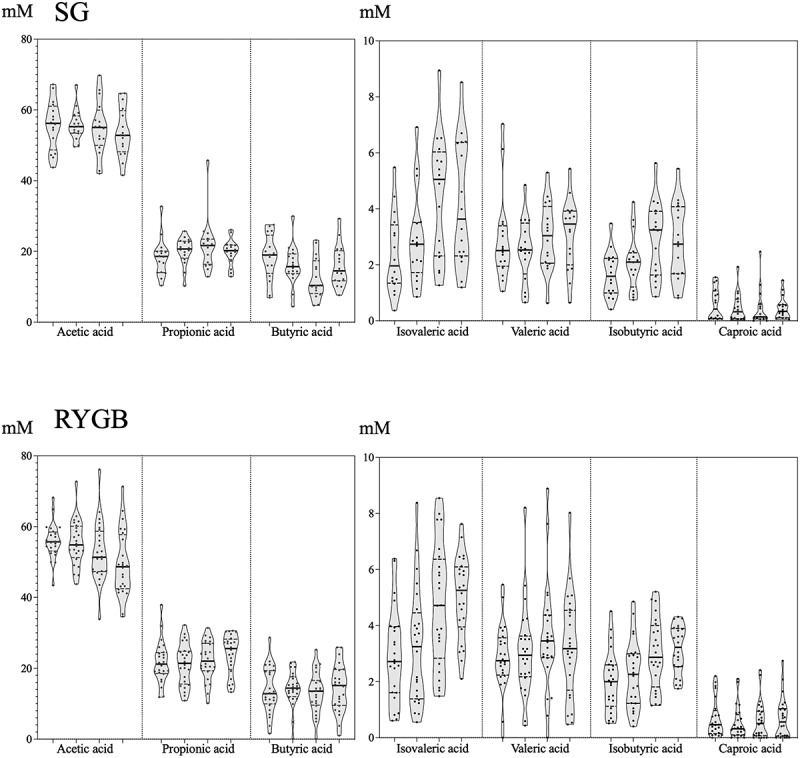
Figure 6.

Evolution of the proportion (left) and absolute concentration (right, expressed in mM) of the majority (acetate, propionate and butyrate) and minority (caproate, isobutyrate, isovalerate and valerate) SCFA measured at the 4 times (from left to right: baseline, diet, 1 month after surgery, 3 months after surgery) for both groups. The horizontal line represents the mean of each distribution.
