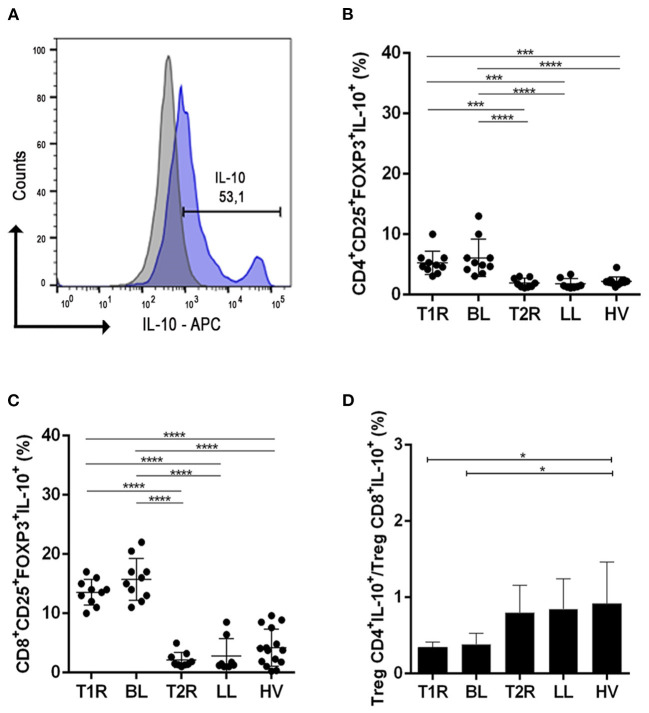
Figure 2.
Analysis of regulatory T cells producing IL-10. Evaluation of CD4+ and CD8+ Treg frequency in blood samples in vitro with no stimuli. Representative histogram from strategy analysis, cells were gated in the regulatory T cell phenotype (A); Frequency of CD4+CD25+Foxp3+IL-10+ (B); CD8+CD25+Foxp3+IL-10+ (C); Ratio of CD4+CD25+Foxp3+IL-10+/CD8+CD25+Foxp3+IL-10 (D). Each symbol represents an individual studied according to the group; the horizontal lines represent the median. One-way Anova was used for statistical analysis where, *p ≤ 0.05, **p ≤ 0.01, ***p ≤ 0.001 and ****p ≤ 0.0001. T1R, Type 1 Reaction; BL, borderline lepromatous; T2R, Type 2 Reaction; LL, polar lepromatous patients; HV, healthy volunteers.

