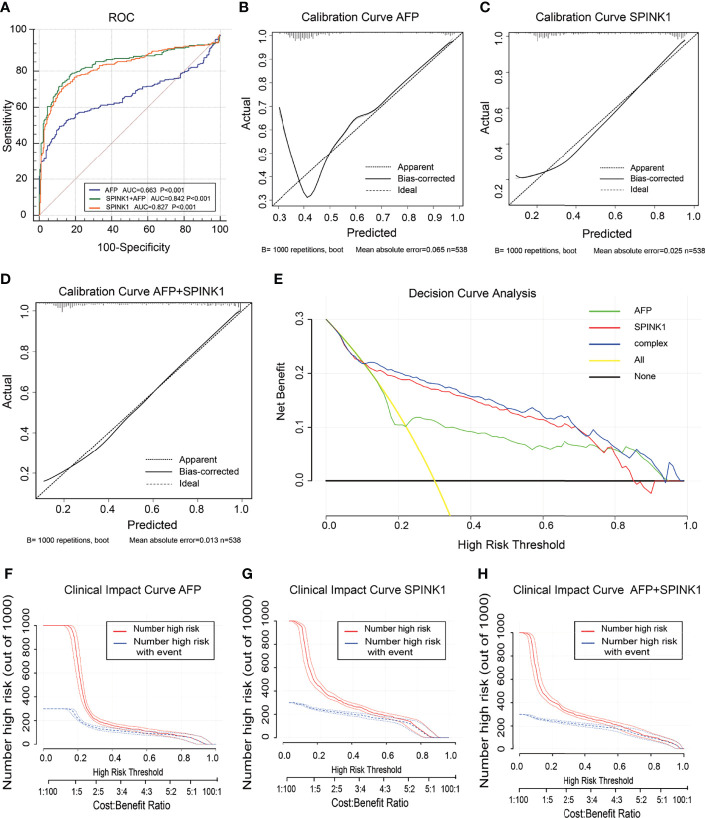
Figure 2.
Discrimination and calibration of hepatocellular carcinoma (HCC) prediction models through transcriptomics analyses in the training dataset. (A) Receiver operating characteristic (ROC) curves and area under the curve (AUC) in the SPINK1, SPINK1 plus alpha-fetoprotein (AFP), and AFP models. (B–D) Calibration curves of AFP (B), SPINK1 (C), and SPINK1+AFP (D). (E) Clinical net benefits in the decision curve analysis (DCA) of SPINK1, SPINK1+AFP, and AFP. Yellow line indicates all HCC patients; middle and horizontal black line denotes non-HCC patients. (F–H) Comparison of the clinical benefits obtained from the clinical impact curve (CIC) analysis of each detection model.

