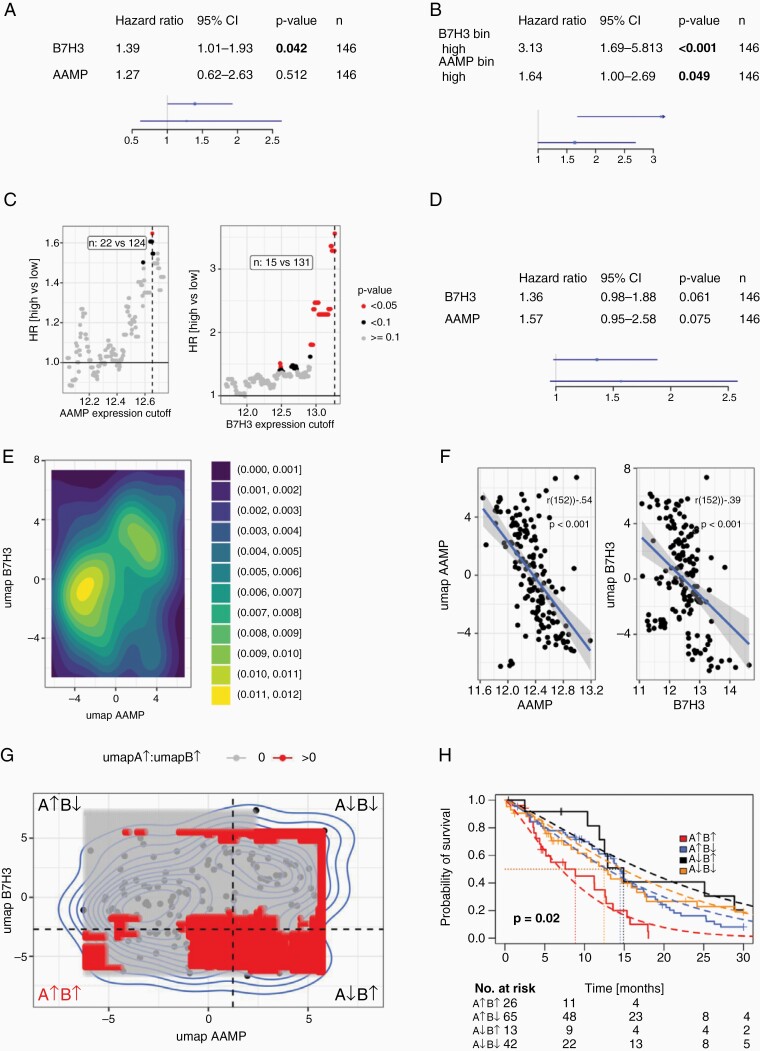
Figure 3.
Prognostic value of AAMP and B7-H3 expression in IDH1wt GBM (TCGA-GBM). Univariate survival analysis with continuous expression level covariate (A) and binarized groups (B). (C) shows the model performance depending on the selected gene expression cutoff, dashed lines correspond to cutoffs shown in B + C. (D) Multivariate survival analysis. (E) Density plot of 1d-umap data for genes associated with AAMP (n = 110) and B7-H3 (n = 434) expression (PBonf < .001, upper and lower 1% quantile of coefficients). (F) Association of AAMP (A) and B7-H3 (B) gene expression with umap values, Pearson correlations. (G) Testing for significant interactions between umap value defined groups, four quadrants are labeled with corresponding AAMP (A) and B7-H3 (B) gene expression. Non-transparent (red) shows areas with significant effects for A↑B↑. Dashed lined indicate lowest observed p-value, corresponding groups are shown in (H) (parametric survival models, Weibull distribution).

