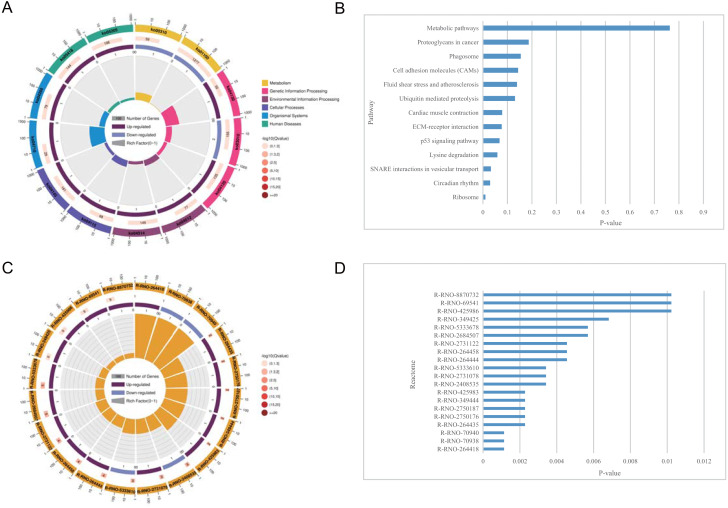
Figure 5. KEGG pathway enrichment and reactome pathway enrichment analysis of DEGs.
(A) Circle plot demonstrating the KEGG pathway enriched by the DEGs. Inner plot color corresponds to the rich factor. The second ring displays up and down genes. The third ring displays Q-values. The outer ring displays GO terms. (B) Statistically significant pathways listed and their colors are shown by P-value. (C) Circle plot demonstrating the reactome pathway enriched by the DEGs. (D) Top 20 statistically significant pathways listed and their colors are shown by P-value.

