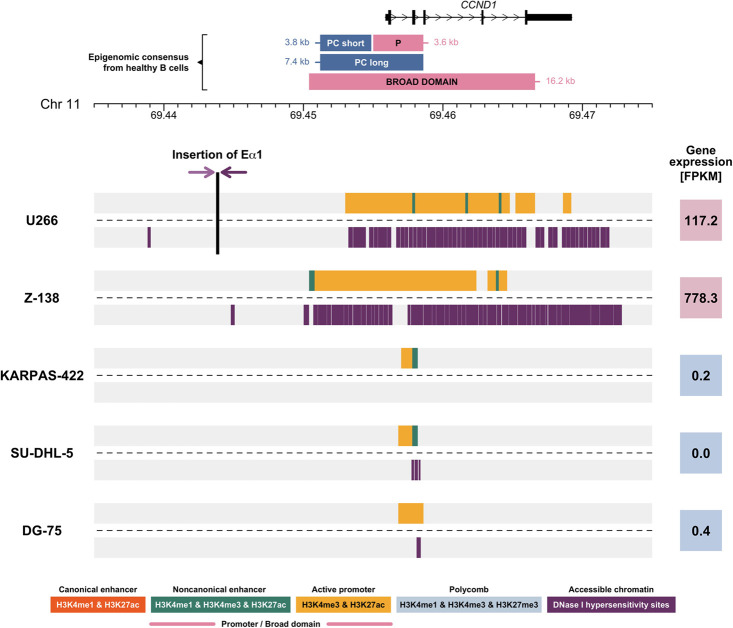
Figure 3.
Chromatin landscape of the CCND1 locus in five cell lines derived from B cell hematological malignancies. The upper line of each cell line (Supplemental Table S3) represents the selected ChIP-seq chromatin states (Supplemental Table S1), and the lower line shows DNase I hypersensitivity sites for the nonvariable region of the IGH locus. The vertical black line in U266 marks position of the inserted Eα1 super-enhancer. The breakpoints within the IGH locus are characterized in Supplemental Figure S5. Shaded-purple arrows symbolize translocation orientation. Numbers in colored squares (red denotes high expression; blue, low expression) show CCND1 expression detected using RNA-seq in fragments per kilobase of transcript per million mapped reads (FPKM). (PC) Polycomb, (P) promoter.

