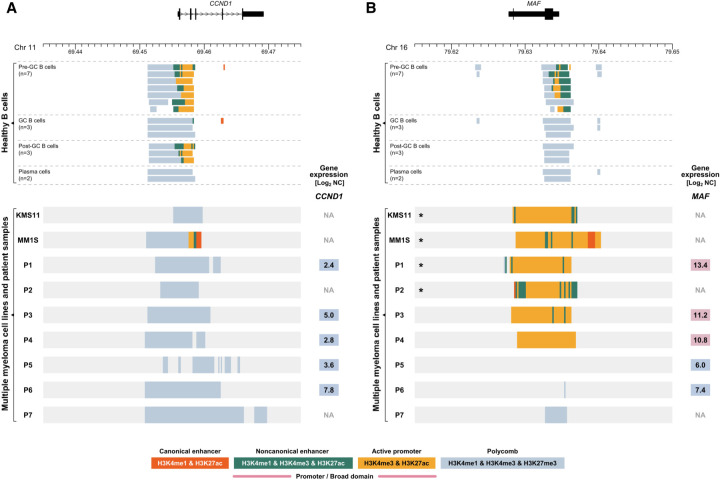
Figure 4.
Chromatin landscape of the CCND1 (11q13) and MAF (16q23) loci in healthy human B cells and multiple myeloma (MM) samples. Upper panels show selected ChIP-seq chromatin states (Supplemental Table S1) of CCND1 (A) and MAF (B) loci in BLUEPRINT healthy B cells. Each line of lower panels represents the ChIP-seq chromatin states for myeloma cell lines KMS11 and MM1S and seven MM patients (P1–P7; patient-derived xenograft material) for CCND1 (A) and MAF (B) loci. Numbers in colored squares (red denotes high expression; blue, low expression) show gene expression detected by RNA-seq and displayed as Log2-normalized counts (Log2 NC). (GC) Germinal center. (*) Sample contains chromosomal translocation involving the displayed region, described in detail in Supplemental Tables S3 and S5.

