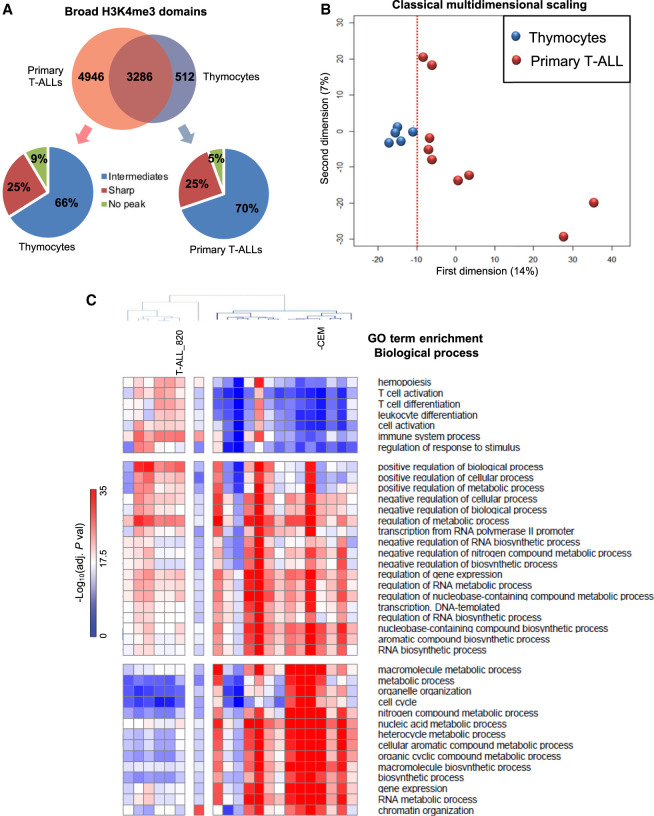
Figure 3.
Comparison of broad H3K4me3 domains between normal T cell populations and T-ALL. (A) Overlap between the broad-associated genes in primary T-ALL samples and thymocytes. The distribution of T-ALL- and thymocyte-specific broad domains in thymocytes and T-ALL samples, respectively, are indicated in the bottom panels. (B) Multidimensional scaling classification of T cell populations and T-ALL samples according to the presence or absence of broad H3K4me3 domains. The dotted red line indicated separation between the normal and leukemic samples. (C) Clustering of normal and T-ALL samples based on the top 10 enriched biological process GO terms of each sample.

