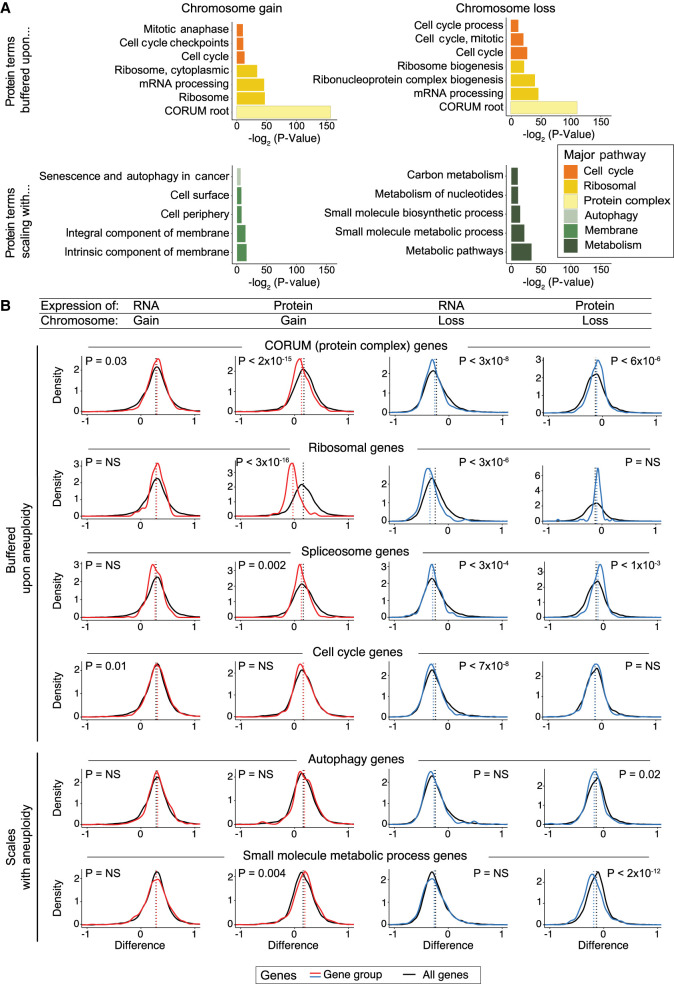
Figure 3.
Specific gene groups tend to show buffering or scaling upon chromosome gain and loss. (A) Bar graphs displaying the biological terms enriched in proteins buffered or scaling upon chromosome gain or loss, categorized by the major overarching pathway. The complete GO term lists are included in Supplemental Tables S4 and S5. (B) Density graphs displaying the difference in RNA or protein expression per gene group upon chromosome gain (red) or loss (blue). The difference in expression for all other genes is shown in black. The mean difference per gene group is indicated by the dotted lines. P-values represent two-sided t-tests between the indicated gene groups and the background set of all other genes. The list of genes in gene groups is in Supplemental Table S6.

